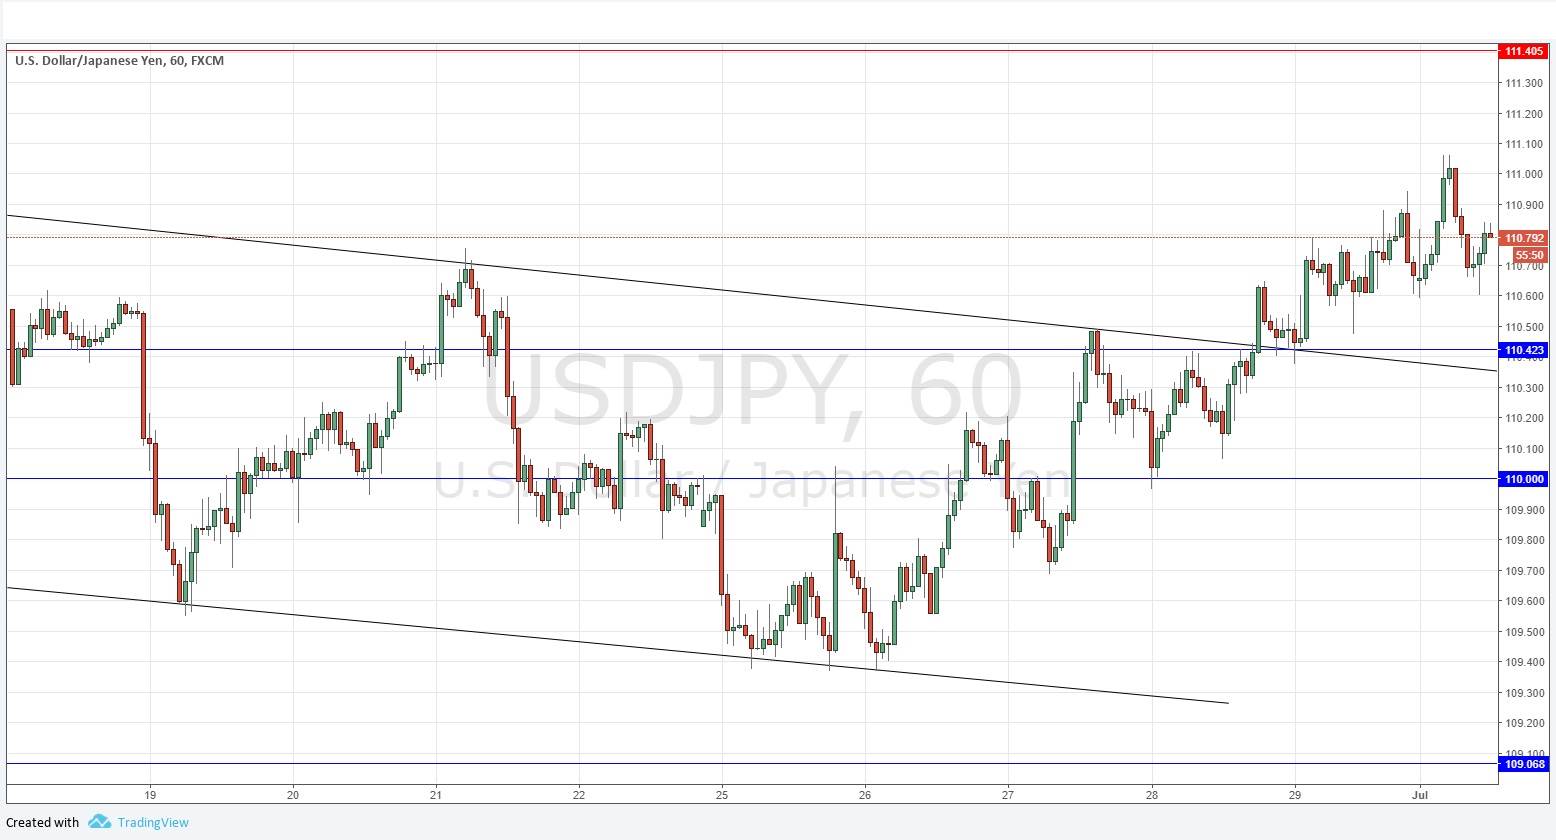
Last Thursday's signals were not triggered, as none of the key levels were reached that day.
Today’s USD/JPY Signals
Risk 0.75%.
Trades must be entered from 8am New York time until 5pm Tokyo time, over the next 24-hour period.
Short Trade
Short entry following a bearish price action reversal on the H1 time frame immediately upon the next touch of 111.41.
Put the stop loss 1 pip above the local swing high.
Move the stop loss to break even once the trade is 20 pips in profit.
Remove 50% of the position as profit when the trade is 20 pips in profit and leave the remainder of the position to ride.
Long Trade
Long entry following a bullish price action reversal on the H1 time frame immediately upon the next touch of 110.42
Put the stop loss 1 pip below the local swing low.
Move the stop loss to break even once the trade is 20 pips in profit.
Remove 50% of the position as profit when the trade is 20 pips in profit and leave the remainder of the position to ride
The best method to identify a classic “price action reversal” is for an hourly candle to close, such as a pin bar, a doji, an outside or even just an engulfing candle with a higher close. You can exploit these levels or zones by watching the price action that occurs at the given levels.
USD/JPY Analysis
I wrote last Thursday that I had no directional bias but would become bullish if the price could get above 110.85. The price did make this break, breaching the descending trend line shown in the price chart below and establishing higher support levels above the psychologically important 110.00 level. The price is close to making a new 6-month high. It is true this push up is quite choppy and maybe fragile also, but there is no technical reason not to have a bullish bias. The support may begin as high as 110.60, with the level at 110.41 looking attractive for a long trade entry if there is a bullish bounce there.
There is nothing important due today concerning the JPY. Regarding the USD, there will be a release of ISM Manufacturing PMI data at 3pm London time.

