WTI Crude Oil
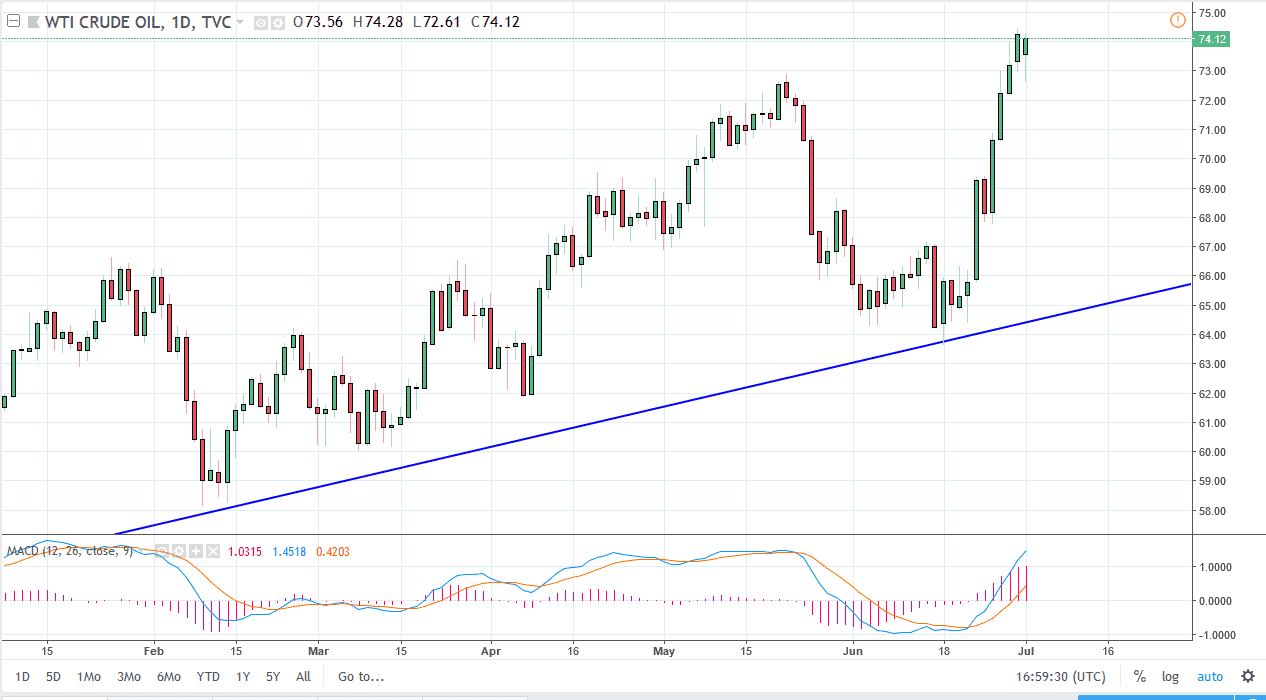
The WTI Crude Oil market pulled back initially during trading on Monday but found enough support underneath at the $72.50 level. By finding that support, we turned around to form a bullish candle, in the shape of a hammer. The question of course now is whether that hammer is a bullish sign, or if it is a “hanging man.” It would only become a “hanging man” if we were to break down below the bottom of the candle, wiping out the support that had been formed during the day. Overall, oil has been very bullish, and I think it is a bit overdone. However, the charts tell us that selling is all but impossible, and I think short-term pullbacks will continue to offer buying opportunities. This could change of course, but right now it looks as if the buyers are firmly in control. $75 above is of course major resistance.
Natural Gas
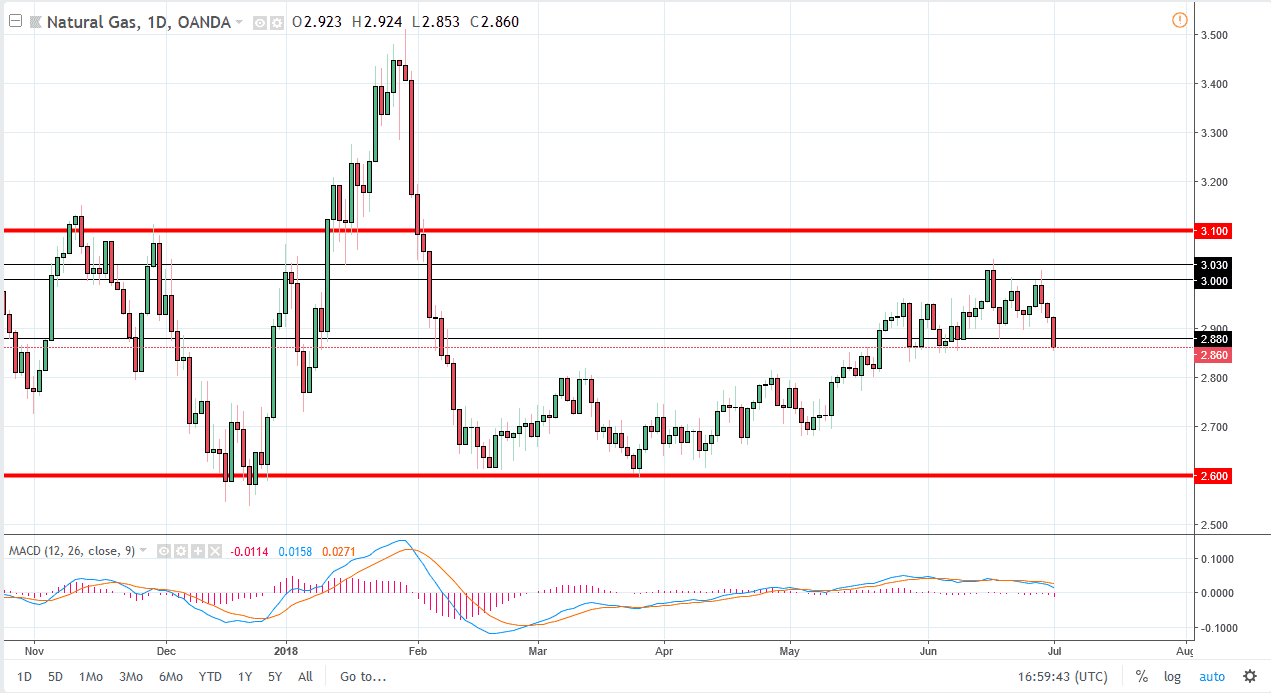
Natural gas markets have broken down rather drastically during the trading session on Monday, slicing through the $2.88 level which had been support recently. I think the market is going to try to take out the $2.85 level underneath, sending the market down to the $2.80 level. Short-term rallies at this point are selling opportunities, as I believe that the last couple of days have shown just how tenuous the uptrend in these markets tend to be. I believe that selling signs of exhaustion will continue to work on short-term charts, and as the US dollar rises it also continues to put bearish pressure on this commodity as it does in the other one. If we can break down below the $2.85 level, I would anticipate a quickening of the pace, and probably throw another short position on.


