BTC/USD
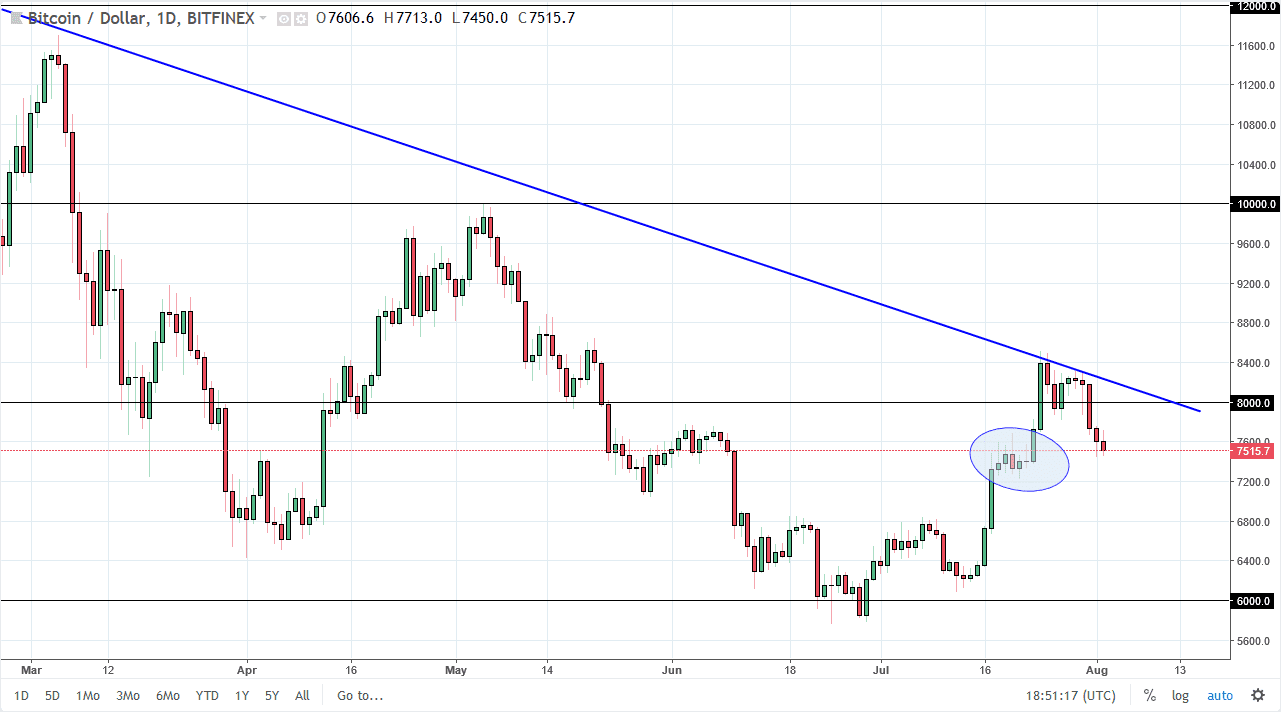
Bitcoin fell again during the trading session on Thursday, reaching below the $7500 level one point. You can see that I have drawn an ellipse on the chart, showing that there is a significant amount of support underneath. If we break down below that area, the market goes much lower. If we bounce from here, we have resistance above at the downtrend line as well. Because of this, I believe that we are looking at either consolidation, or a potential break down from here, testing the lows again. I think the bitcoin does look a bit soft, but a bounce from here could change attitudes rather quickly. If we can make a fresh, new high, then bitcoin goes higher. Obviously, the downtrend line is still very much in effect from what we can see on the charts.
BTC/JPY
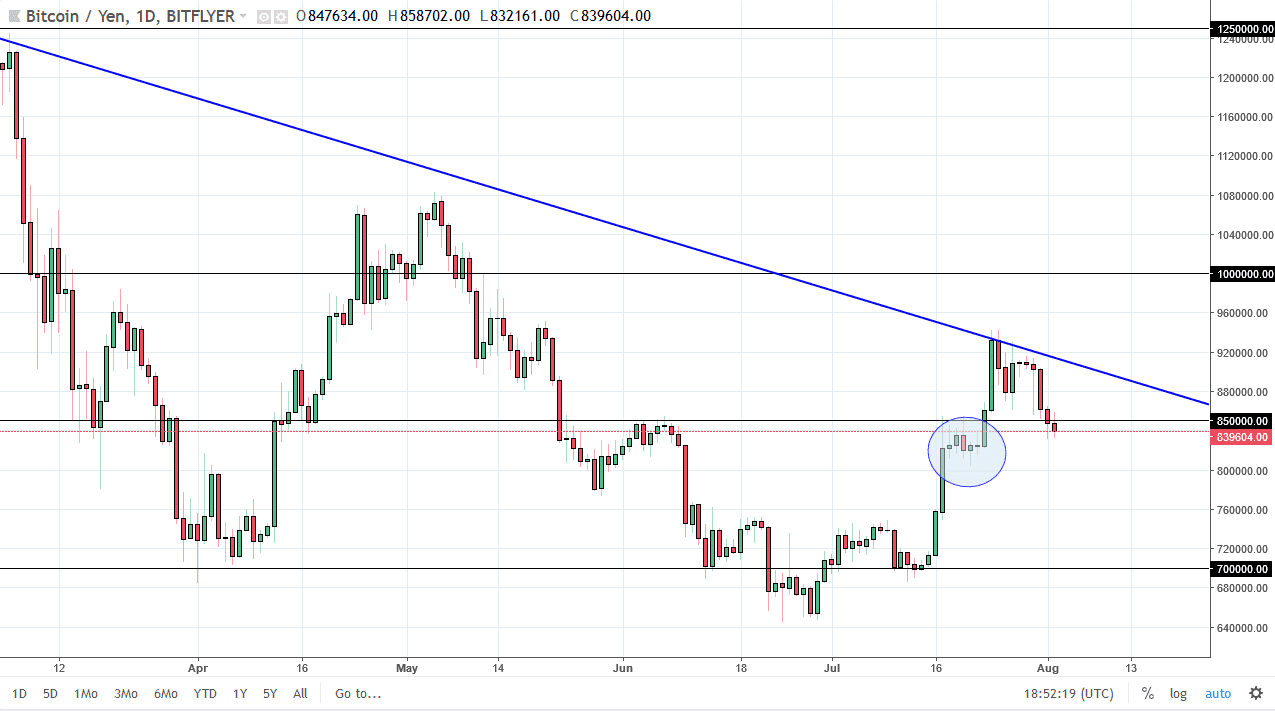
This pair has found a bit of support underneath, shown at the ellipse again. The ¥800,000 level is a trigger for selling from what I see, and I would be aggressively short of this market down to at least the ¥700,000 level after that. The alternate scenario of course is that we turn around and reach towards the downtrend line. If we can clear the ¥925,000 level, the market should then go to the ¥1 million level. Keep in mind that these pairs will move in the same direction, as the Bitcoin market tends to move in one direction overall. Having said that, I do find it interesting that the downtrend line has held, which of course is not a very good sign at all. If we do break out to the upside, I think longer-term “buy-and-hold” traders will get involved, and the downtrend might be over finally.


