The difference between success and failure in Forex trading is very likely to depend upon which currency pairs you choose to trade each week, and not on the exact trading methods you might use to determine trade entries and exits. Each week I am going to analyze fundamentals, sentiment and technical positions in order to determine which currency pairs are most likely to produce the easiest and most profitable trading opportunities over the next week. In some cases it will be trading the trend. In other cases it will be trading support and resistance levels during more ranging markets.
Big Picture 19th August 2018
In my previous piece last week, I forecasted that the best trades would be short EUR/USD and GBP/USD. These trades finished indifferently: while the EUR/USD rose by by 0.22% the GBP/USD fell by 0.15%, producing an average loss of 0.04%.
Last week saw a rise in the relative value of the New Zealand Dollar, and a fall in the relative value of the British Pound. However, the values involved were small, and there is not really a “flow” pattern that can be used to characterize the past week.
The major development in the Forex market last week remains instability in the value of the Turkish Lira, and the sanctions/tariffs dispute between Turkey and the U.S.A., which might even end up taking Turkey out of NATO and lead to the creation of a new anti-U.S. Dollar trade bloc. The ratings agency has lowered Turkey’s sovereign debt rating from BB- to B+ which won’t help the Lira. However, it now seems unlikely that a decline in the Lira will cause a problem for European banks and the Euro itself through contagion / exposure.
Fundamental Analysis & Market Sentiment
Fundamental analysis tends to support the U.S. Dollar, as American economic fundamentals continue to look relatively strong. However, sentiment and technical factors seemed to be working against the Dollar by the end of the week and boosting the Euro and certain commodity currencies such as the Canadian and New Zealand Dollars.
The week ahead will probably be dominated by the forthcoming U.S. FOMC Meeting Minutes. The coming week is likely to be a little less busy and less volatile than the past week, although if the Turkish crisis worsens, it could be more volatile.
Technical Analysis
U.S. Dollar Index
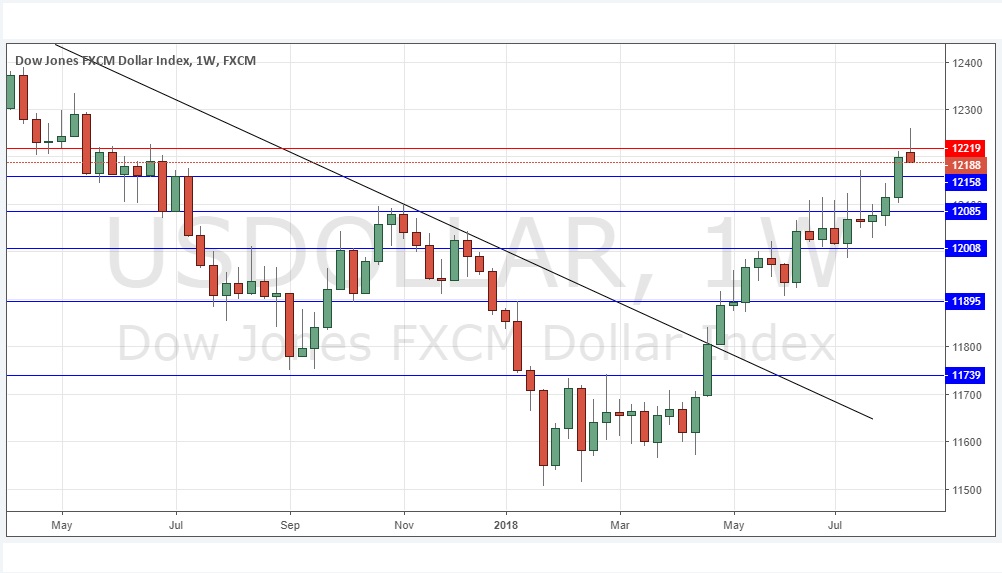
The weekly price chart below shows that after last week’s bullish breakout above 12158, the Index has now printed a bearish pin candlestick which rejected the resistance level at 12219. However, the Index is clearly in a long-term bullish trend. This still suggests that the outlook for the U.S. Dollar is bullish, but there is clearly reason for caution, and perhaps to expect at least a pause in any further immediate rise.
GBP/USD
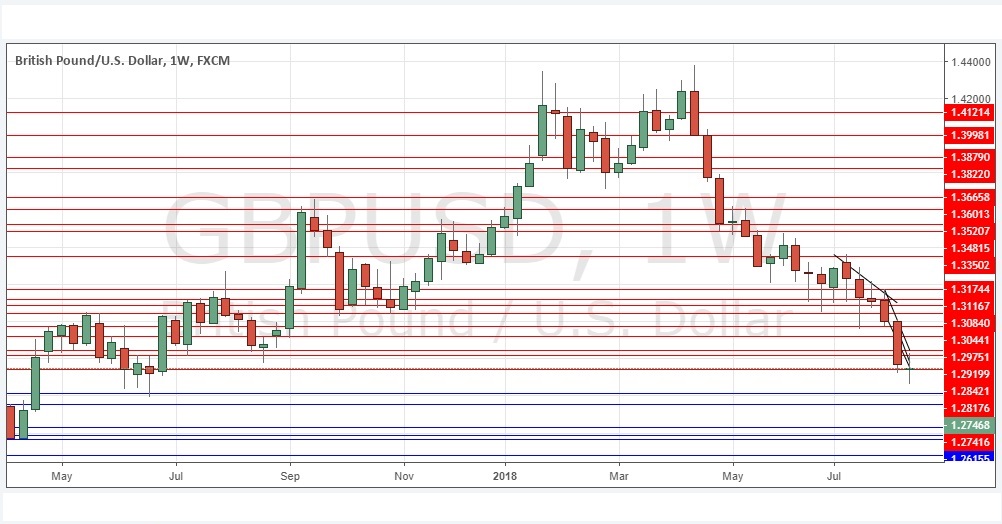
This pair is technically in a long-term downwards trend, as is shown clearly by the bearish action over the past 17 weeks or so. Although we saw long lower wicks over recent weeks, suggestive of long-term buying close to 1.3000, we have also seen the price fall very strongly recently. Although the price barely fell this week, with a weekly doji candlestick forming, the overall picture looks clearly bearish on the long-term, weekly chart below.
EUR/USD
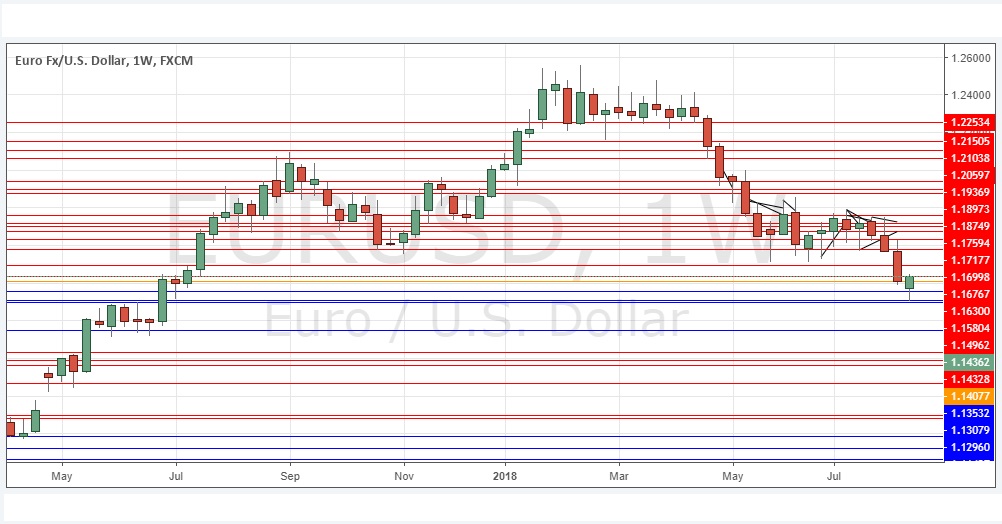
Although we have seen a consolidation here over most of the past several weeks, which suggested a long-term trend change to bullish was increasingly becoming a possibility, we have seen in recent weeks some very decisively bearish price action, with a very long, strong bearish candlestick making another lowest weekly close in over a year the week before last, which was a bearish sign. The pair is in a long-term bearish trend, but last week’s candlestick is strongly bullish, suggesting more short-term bullish momentum. So, the time is not right to be shorting this pair.
S&P 500 Index
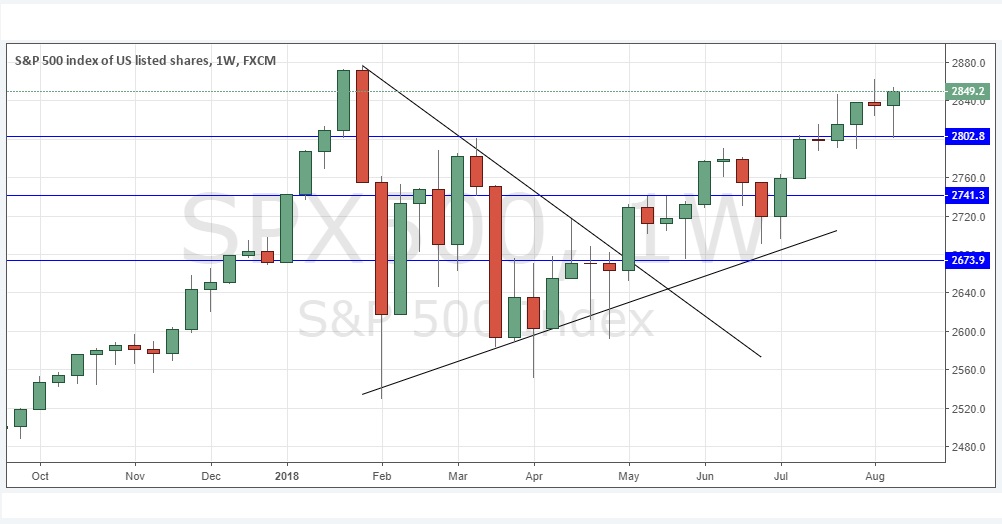
The major U.S. stock market index printed a nicely strong bullish candlestick last week, basing off the support level at 2802.8. If it continues to break recent high prices, it may go on to make a new all-time high, which would potentially be a very bullish sign.
Conclusion
Bearish on the GBP/USD; bullish on the S&P 500 Index above last week’s high price.


