The difference between success and failure in Forex trading is very likely to depend upon which currency pairs you choose to trade each week, and not on the exact trading methods you might use to determine trade entries and exits. Each week I am going to analyze fundamentals, sentiment and technical positions in order to determine which currency pairs are most likely to produce the easiest and most profitable trading opportunities over the next week. In some cases it will be trading the trend. In other cases it will be trading support and resistance levels during more ranging markets.
Big Picture 9th September 2018
In my previous piece last week, I forecasted that the best trades would be short AUD/USD, and bullish on the S&P 500 Index. These trades finished indifferently: while the AUD/USD fell by 1.21% the S&P 500 Index fell by 1.07%, producing an average win of only 0.07%.
Last week saw a rise in the relative value of the U.S. Dollar, and a fall in the relative value of the commodity currencies such as the Australian, New Zealand, and Canadian Dollars.
Last week’s Forex market was dominated by strong U.S. economic data at the end of the week, but also increased U.S. trade tariffs, and weakness in Asian stock markets both of which have hit commodity currencies.
Fundamental Analysis & Market Sentiment
Fundamental analysis tends to support the U.S. Dollar, as American economic fundamentals continue to look relatively strong. Sentiment seems to have given the Dollar a boost over the week, but trade war fears remain and continue to boost other safe havens such as the Swiss Franc and Japanese Yen periodically.
The week ahead is likely to be dominated by a slew of key British economic data, plus central bank input both there and in the Eurozone. There will also be a release of U.S. CPI (inflation) data. There is increasing speculation over the terms of a possible Brexit deal, as the British Government is keen to agree a deal with the European Union within the next few weeks if possible.
Technical Analysis
U.S. Dollar Index
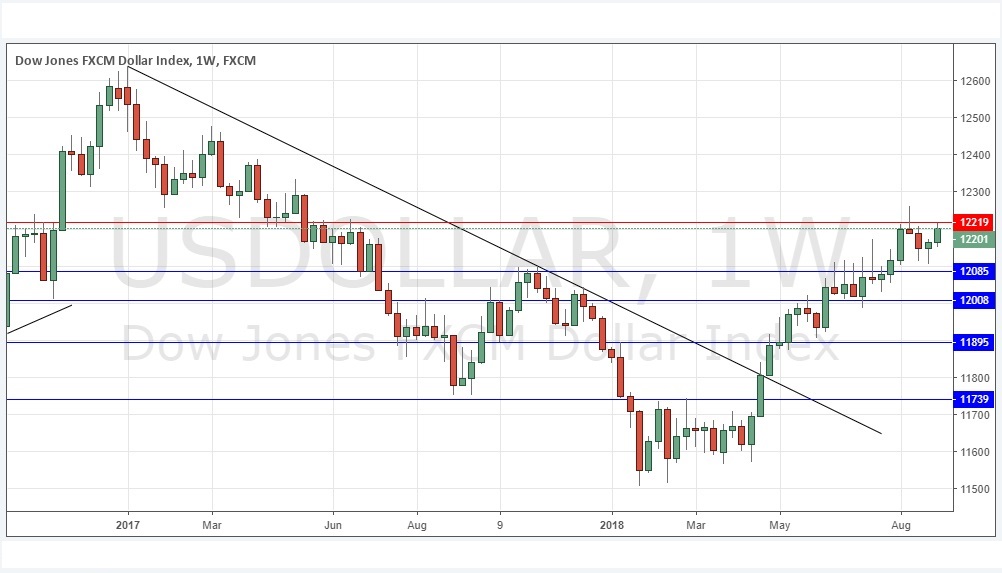
The weekly price chart below shows that after last week’s bullish pin candlestick, the price has continued to rise with another bullish candlestick which closed near its high, but still below the resistance level at 12219. The Index is clearly in a long-term bullish trend. This still suggests that the outlook for the U.S. Dollar is bullish, but there is obviously reason for caution, however it does look more likely that the resistance level at 12219 will be broken.
AUD/USD
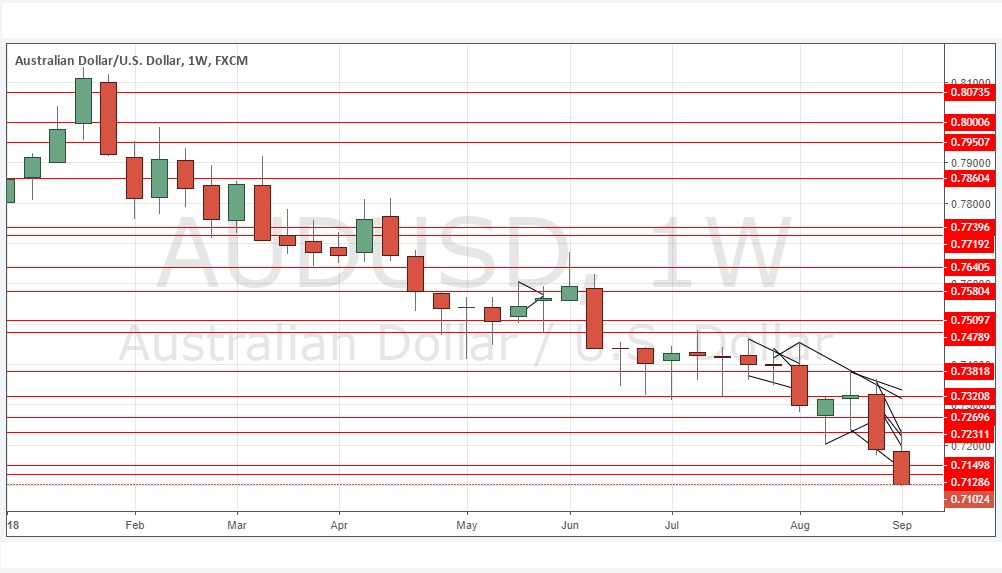
This pair is in a strong long-term downwards trend and has been falling steadily over the past 6 months. It has shown the greatest long-term weakness of any major currency. Last week’s candlestick was long and strong and closed right on its low, all of which are bearish signs, as is the fact that it continues to make new multi-year lows below the inflection point at 0.7150. The only note of caution lies in the fact the price is approaching a major psychological level at 0.7000.
EUR/USD
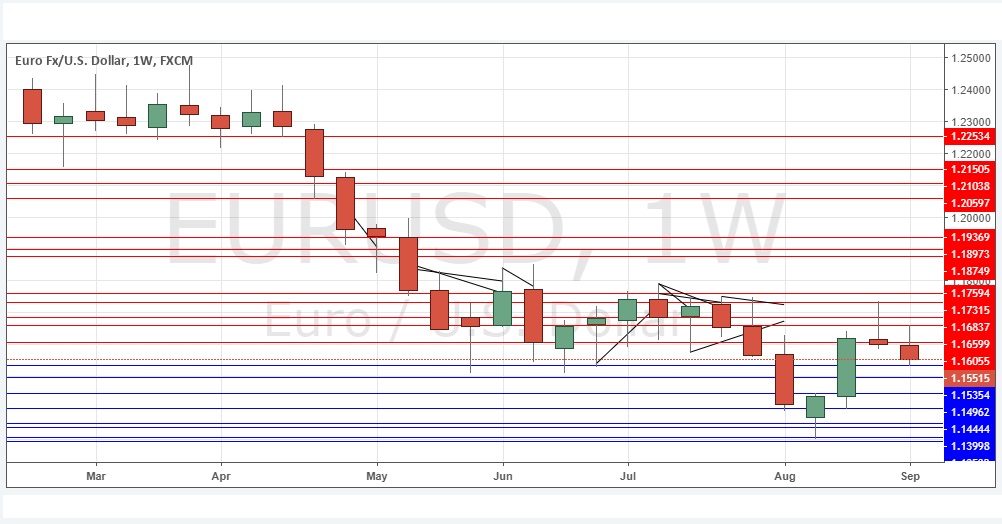
The Euro is showing slight long-term weakness, and the U.S. Dollar is showing strength. Although the price has been largely consolidating over recent weeks, we see a bearish candlestick set-up in the weekly price chart below, with last week printing a bearish pin candlestick. The problem for bears is that this pair tends to shift backwards and forwards, so while there is movement to be traded, it is best to pay a lot of attention to what is happening over the short-term and to be relatively conservative in taking profits.
Conclusion
Bearish on the AUD/USD currency pair.


