Gold prices ended Thursday’s session up $3.38 an ounce as a lower U.S. dollar index prompted a bit of buying interest in the gold market. The U.S. dollar index dropped to a 2.5-month low yesterday on receding fears of a U.S.-China trade war. World stock markets were mostly higher yesterday. The Dow Jones Industrial Average and S&P 500 set new highs. Investors are awaiting next week’s Federal Open Market Committee meeting.
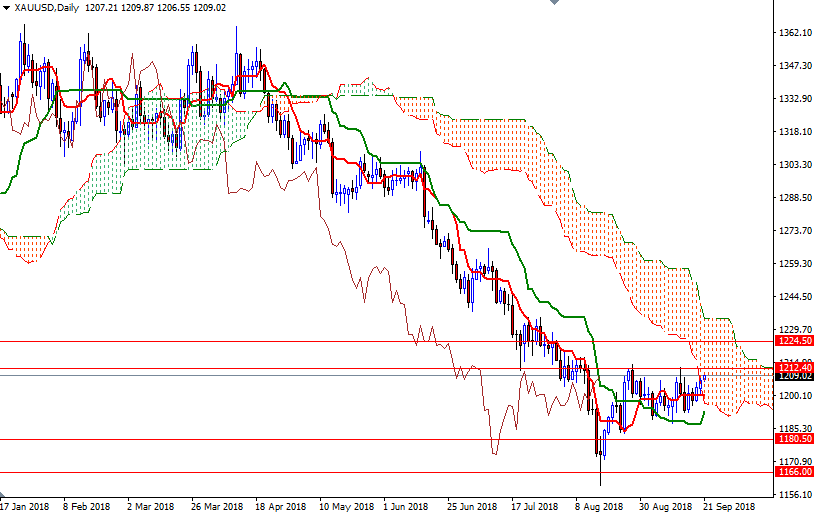
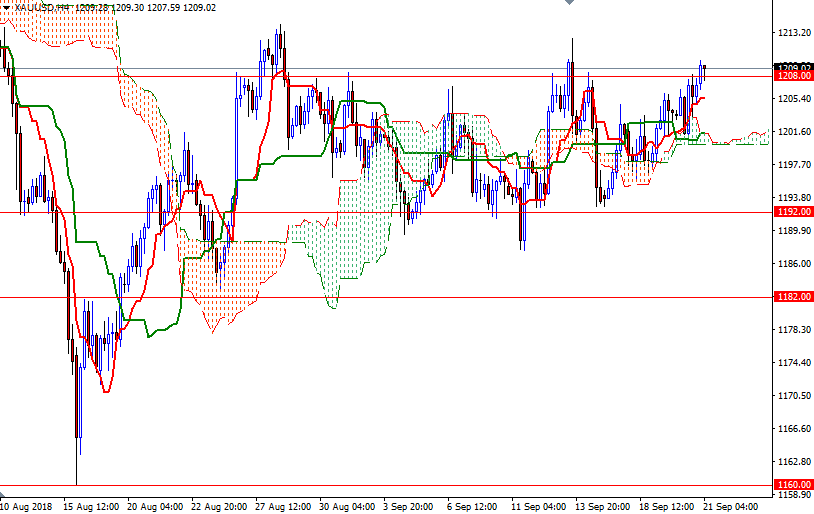
The short-term charts are bullish, with the market trading above the 4-hourly and the hourly Ichimoku clouds. We have positive Tenkan-Sen (nine-period moving average, red line) - Kijun-Sen (twenty six-period moving average, green line) crosses on both charts. However, there is strong chart resistance, which prevented gold from going higher in recent months, in the 1214-1212.40 area.
The bulls have to pass through this barrier to set sail for 1218. If XAU/USD successfully climbs above 1218, then the market will probably visit the 1226-1224.50 area next. A daily close above 1226 could trigger a move to 1240/35. To the downside, the initial support stands in the 1206.50-1205.50 zone. If prices fall below 1205.50, the Kijun-Sen on the H1 chart, then the market will return to the 1203.40-1201.20 area occupied by the hourly Ichimoku cloud. The bears have to produce a daily close below 1198 to take the reins and challenge 1195.


