Gold prices settled at $1219.04 an ounce on Friday, rising 1.25% over the course of the week, as a rout in global stock markets prompted investors to seek shelter in safe-haven assets. U.S. stocks tumbled to their lowest level in three months. Weaker-than-expected U.S. inflation raised bets that the Federal Reserve will take its foot off the gas on raising interest rates. However, Fed officials said rates need to continue to move toward an estimated neutral level. The euro rose following the release of the minutes from the last European Central Bank meeting, which suggested the central was on track to normalize its ultra-loose monetary policy, but rising anxiety surrounding Italy’s finance limited the upside potential.
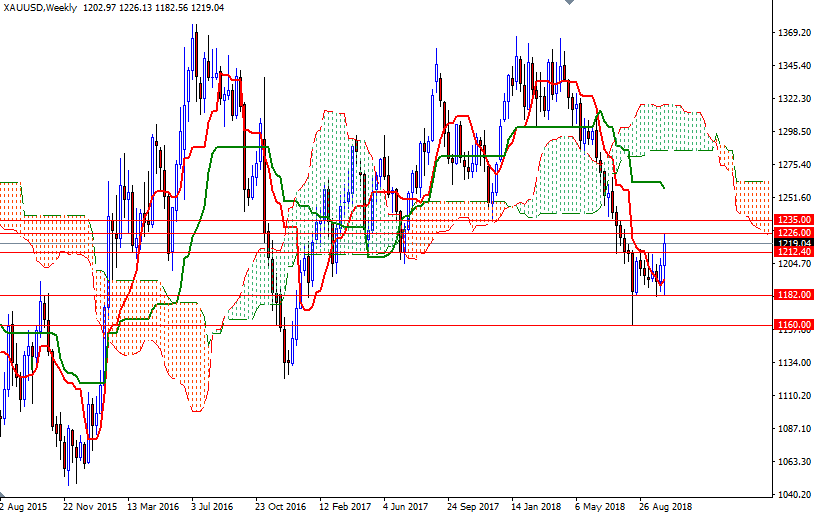
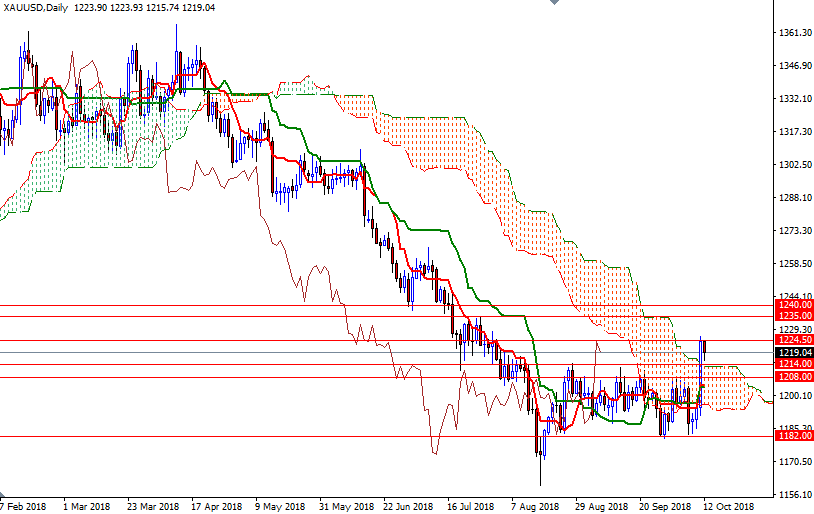
Technical buying was also featured following the bullish upside breakout from a sideways trading range. Gold prices reached the 1226-1224.50 zone as anticipated after the market broke through a key technical resistance in 1214-1212.40. The bulls have the slight overall near-term technical advantage, with the market trading above the daily and the 4-hourly Ichimoku clouds. The Tenkan-sen (nine-period moving average, red line) and Kijun-sen (twenty six-period moving average, green line) are positively aligned. The daily Chikou-span (closing price plotted 26 periods behind, brown line) is above prices, but it is still below the daily cloud. Also note that XAU/USD continues to reside below the cloud on the weekly chart. All these suggest sideways-to-higher price action in the near term.
If XAU/USD successfully passes through 1226-1224.50, look for further upside with 1235 and 1240 as targets. The bulls have to produce a daily close above 1240 to set sail for 1252/48. A break through there could offer enough inspiration for the bulls to send prices higher to 1261/0. The top of the daily cloud sits in the 1214-1212.40 area so the bears need to drag prices below there to make an assault on the next support in 1208/5. If XAU/USD gets back below 1205, the market will be aiming for 1202 or even 1198/6. Below there, the 1193/1 area (the bottom of the daily cloud) stands out as a strategic support.


