Gold prices ended Friday’s session up $3.28 an ounce, extending gains to a second straight session, as the dollar came under pressure after the Labor Department reported that the economy added 134000 jobs in September, well below consensus estimates of 185000. Fed officials said that gradual rate hikes will be enough to tame inflation, but a jump in longer-term borrowing costs has increased doubts about that optimistic scenario. The rising volatility in global equity markets also provided some support to gold. The surge in U.S. Treasury yields weighed on stocks.
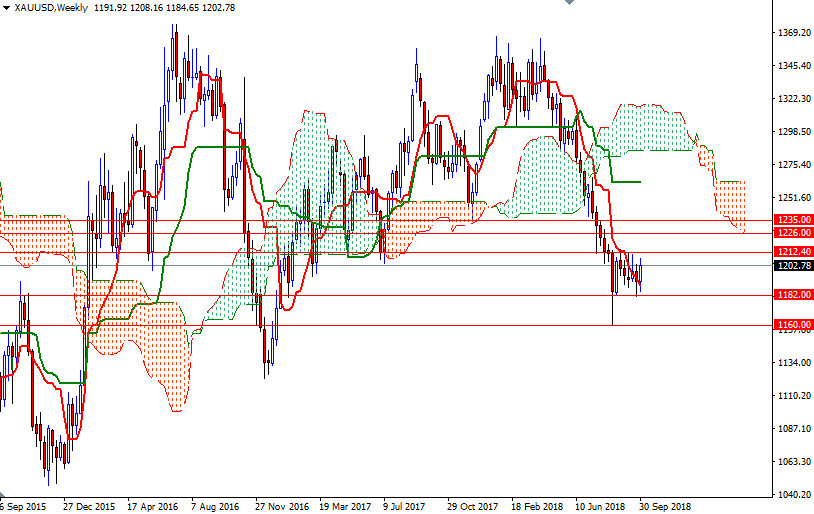
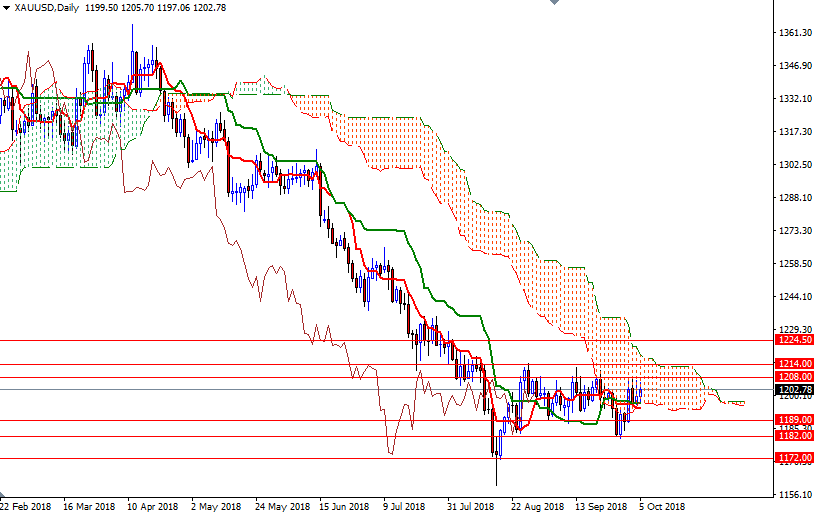
Trading below the weekly Ichimoku cloud, along with the negative Tenkan-sen (nine-period moving average, red line) and Kijun-sen (twenty six-period moving average, green line) crosses on both the weekly and the daily charts, suggests that the bears have the overall technical advantage. However, also keep in mind that XAU/USD has been trading sideways since the last week of August, indicating a near-term market bottom is in place.
Technically, the first upside barrier comes in around 1208, and that is followed by 1214-1212.40, the top of the daily Ichimoku cloud. If prices see a bullish upside breakout from the sideways trading range that has been in place on the daily chart for seven weeks, look for further upside with 1218 and 1226-1224.50 as targets. The bulls have to produce a close above 1226 to challenge the next barrier in the 1240-1235 zone. To the downside, the initial support sits in the 1196-1194 area, where the bottom of the daily cloud and the daily Tenkan-sen converge. A break below 1194 could drag prices back to 1189. Below there, the 1182-1180 area stands out as a strong technical support. If XAU/USD successfully dives below 1180, then the next stop will be 1173-1172.


