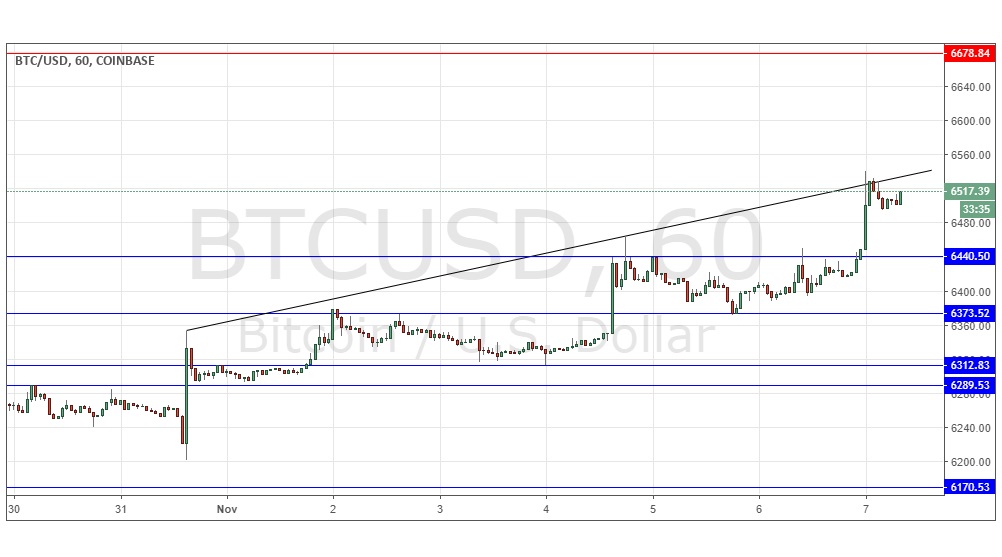
Yesterday’s signals were not triggered, as none of the key levels were ever reached.
Today’s BTC/USD Signals
Risk 0.75% per trade.
Trades must be entered before 5pm Tokyo time today, during the next 24-hour period only.
Long Trades
Long entry after a bullish price action reversal on the H1 time frame following the next touch of $6,440 or $6,374.
Put the stop loss 1 pip below the local swing low.
Move the stop loss to break even once the trade is $200 in profit by price.
Remove 50% of the position as profit when the trade is $200 in profit by price and leave the remainder of the position to run.
Short Trade
Short entry after a bearish price action reversal on the H1 time frame following the next touch of $6,679.
Put the stop loss 1 pip above the local swing high.
Move the stop loss to break even once the trade is $200 in profit by price.
Remove 50% of the position as profit when the trade is $200 in profit by price and leave the remainder of the position to run.
The best method to identify a classic “price action reversal” is for an hourly candle to close, such as a pin bar, a doji, an outside or even just an engulfing candle with a higher close. You can exploit these levels or zones by watching the price action that occurs at the given levels.
BTC/USD Analysis
I wrote yesterday that although I would still say the picture is bullish, I would not be confident that the price would necessarily advance higher right away. I would take a bullish bias if there were a retracement to and bullish bounce at $6,374.
I was correct to be generally bullish, but I should have had more optimism, as the price has continued to rise very healthily. There is a trend line shown in the chart below which arguably blocked a further advance. It is likely there is a new higher support level at $6,440. I would take a bullish bias today if the price can advance beyond the trend line and stay there for two hours.
There is nothing important due today concerning the USD.

