S&P 500
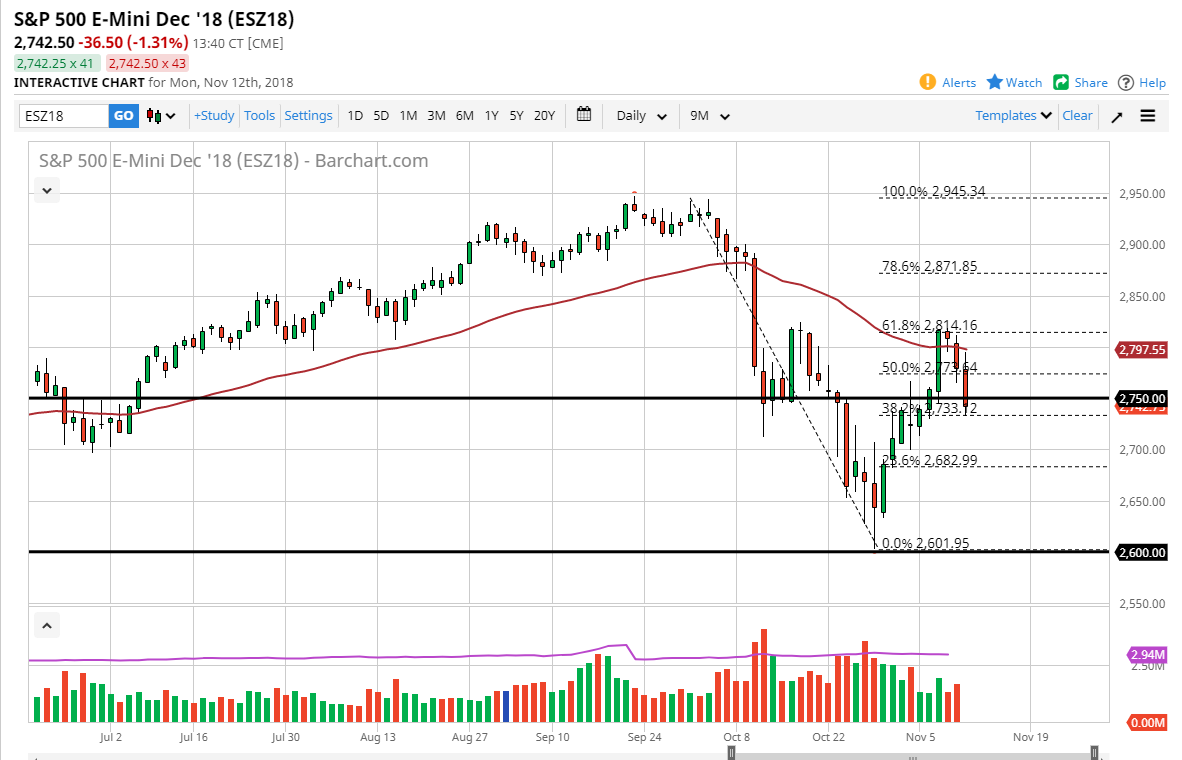
The S&P 500 initially tried to rally but then broke down rather significantly during trading on Monday, breaking below the 2750 level, showing signs of weakness yet again. At this point, we have broken down below the massive candle after the elections, and that of course is a very negative sign. We have turned around at the 61.8% Fibonacci retracement level, an area that is quite common for traders to pay attention to. If we break down below the bottom of the candle stick for the trading session on Monday, then we should continue to go lower, perhaps reaching down to the 2700 level. At this point, I’m a bit suspicious of rallies and think that short-term trading opportunities will continue to show themselves on small rallies that show signs of exhaustion, as the selling pressure certainly has become quite drastic. The 50 EMA is showing signs of resistance, just that the 61.8% Fibonacci retracement level. I think rallies are not to be trusted at this point.
NASDAQ 100
The NASDAQ 100 tried to rally during the trading session on Monday, but then broke down significantly below the 7000 level, reaching down towards the 6850 level. At this point, the market looks very vulnerable and I believe that technology stocks will continue to be dumped. The 50 EMA also offered a lot of resistance on the chart, and I think that the sellers are going to continue to go lower. If we break down below the 6800 level, the market should then go down to the 6600 level. At this point, I don’t think that you can trust rallies over here as well and I would be looking for signs of exhaustion to sell.


