S&P 500
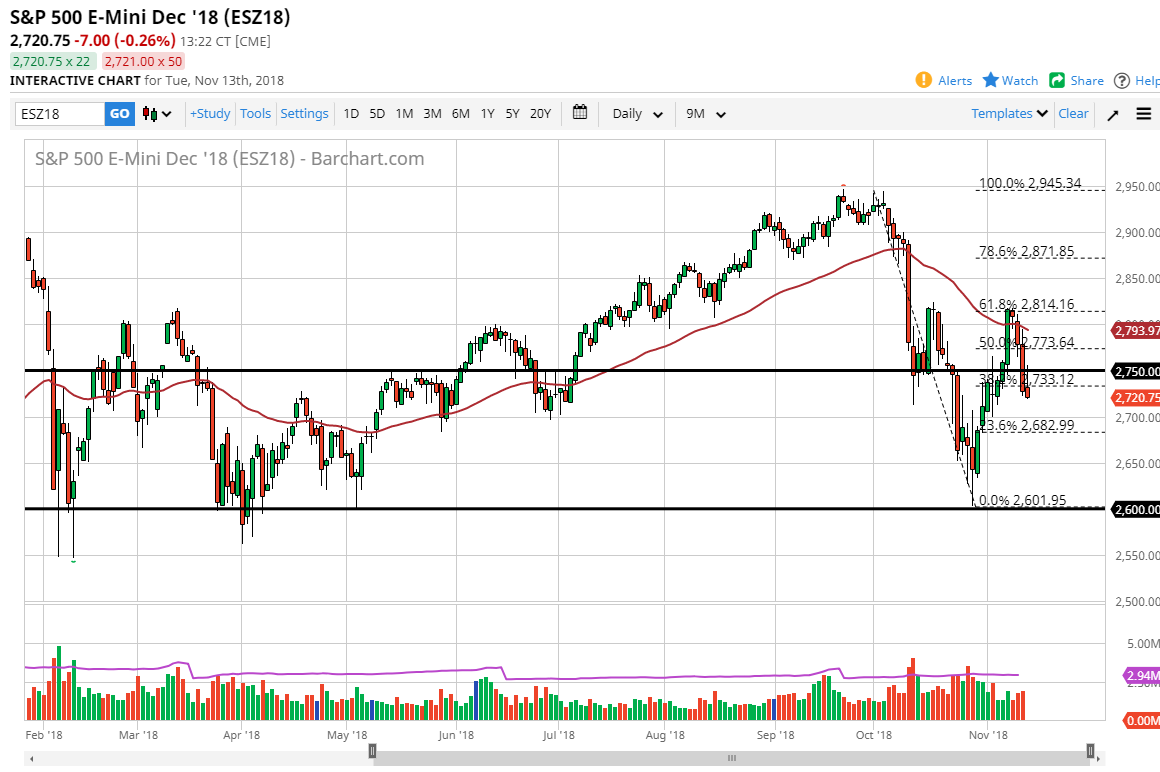
The S&P 500 initially shot higher during the trading session on Tuesday but found the 2750 level to be too much to hang onto and we turn around of form a shooting star. This chart looks horrible and I think we’re going to go lower. At this point I would anticipate a move to the 2700 level, but if we did break above the top of the candle stick for the Tuesday session, then I think the 50 EMA comes into play as resistance. Otherwise, if we break down below the bottom of the candle stick and the 2700 level, then I think we unwind to the 2650 level, but then eventually the 2600 level after that as it is a massive support level on the longer-term charts.
NASDAQ 100
The NASDAQ 100 rallied a bit during the trading session, but then turned around to form a shooting star. At this point it looks a lot like continuation to the downside, perhaps reaching down to the 6750 level, perhaps down to the 6500 level after that. The NASDAQ 100 has been hammered as Apple continues to selloff, and of course there are a lot of concerns about the Sino-American relations. At this point, it’s not until we get a daily close above the 50 EMA that I’m comfortable buying. If that happens, then I think the market can continue to go higher, perhaps reaching towards the 7500 level. If we were to break down below the 6500 level, that would send this market much lower, as it would be such a significant break down of support. I think at this point rallies are still going to be sold, as there are a lot of headwinds out there.


