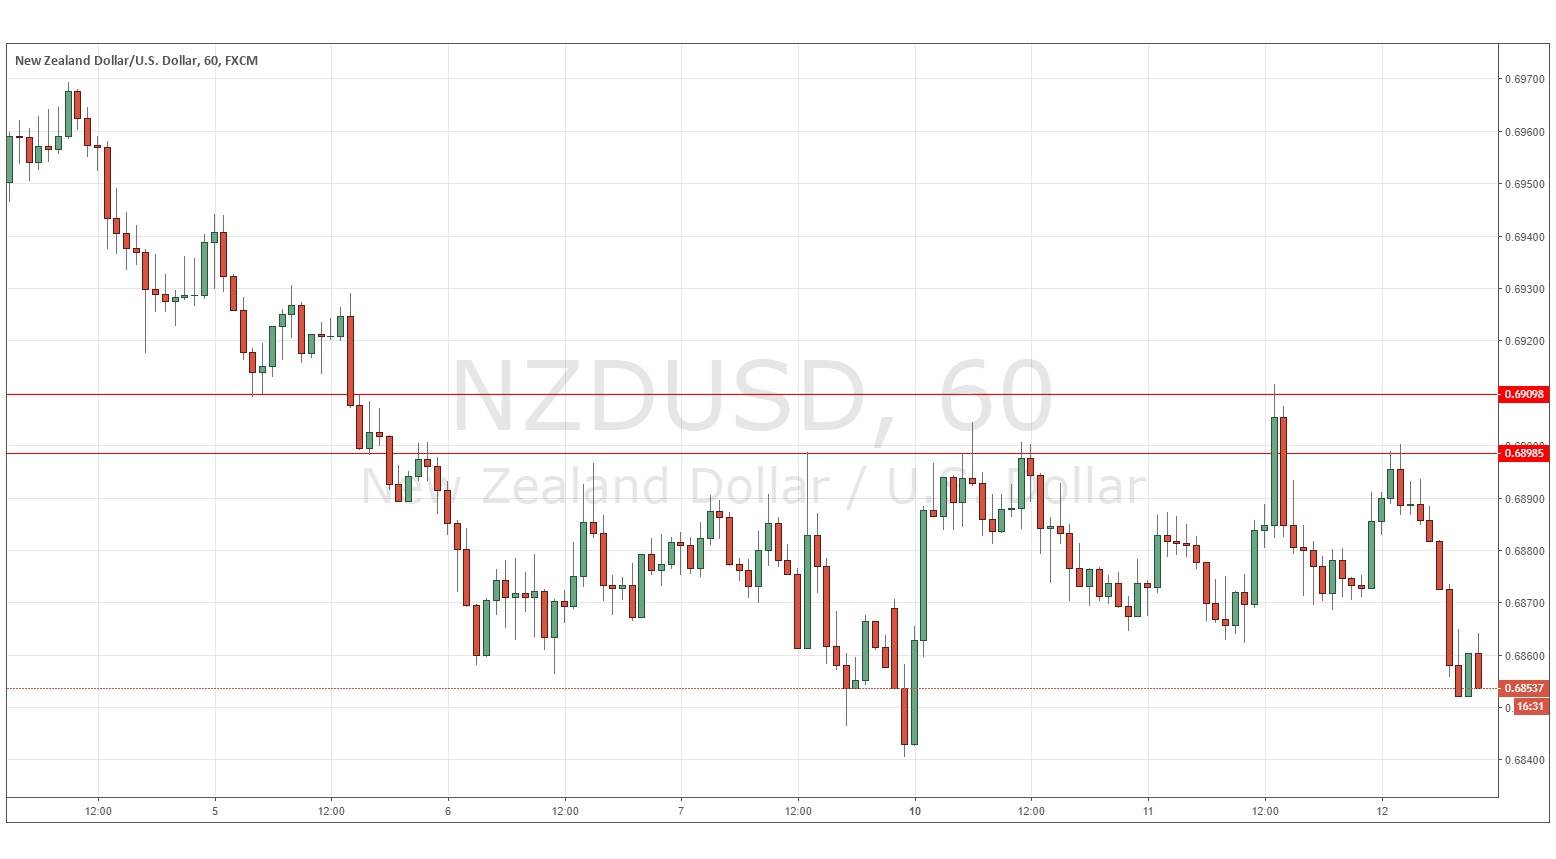
Yesterday’s signals were not triggered, as the bearish price action unfortunately happened a little higher than the resistance level, I had identified at 0.6899.
Today’s NZD/USD Signals
Risk 0.75%.
Trades must be taken between 8am New York time and 5pm Tokyo time, during the next 24-hour period only.
Short Trades
Go short following bearish price action on the H1 time frame immediately upon the next touch of 0.6899 or 0.6910.
Put the stop loss 1 pip above the local swing high.
Adjust the stop loss to break even once the trade is 20 pips in profit.
Remove 50% of the position as profit when the trade is 20 pips in profit and leave the remainder of the position to run.
The best method to identify a classic “price action reversal” is for an hourly candle to close, such as a pin bar, a doji, an outside or even just an engulfing candle with a higher close. You can exploit these levels or zones by watching the price action that occurs at the given levels.
NZD/USD Analysis
I wrote yesterday that there was a meaningful downwards movement which looked likely to continue for a while. There were no obvious key support levels below for a long way down, so I thought that the price could keep falling and falling. This could be a short trade worth letting ride. I had a cautiously bearish bias until 0.6840.
The situation developed a little differently: after briefly spiking up to an area a few pips above the resistance level at 0.6899, it fell again, and then retraced back to the level from which is has fallen quite strongly over recent hours. Ironically, I have to say the same thing again today that I said yesterday – the picture looks bearish and the price could fall much further. I take a bearish bias until at least 0.6840 and see a good possibility that the price might break significantly lower than that over the coming days.
There is nothing important due today concerning the NZD. Regarding the USD, there will be a release of CPI data at 1:30pm London time.

