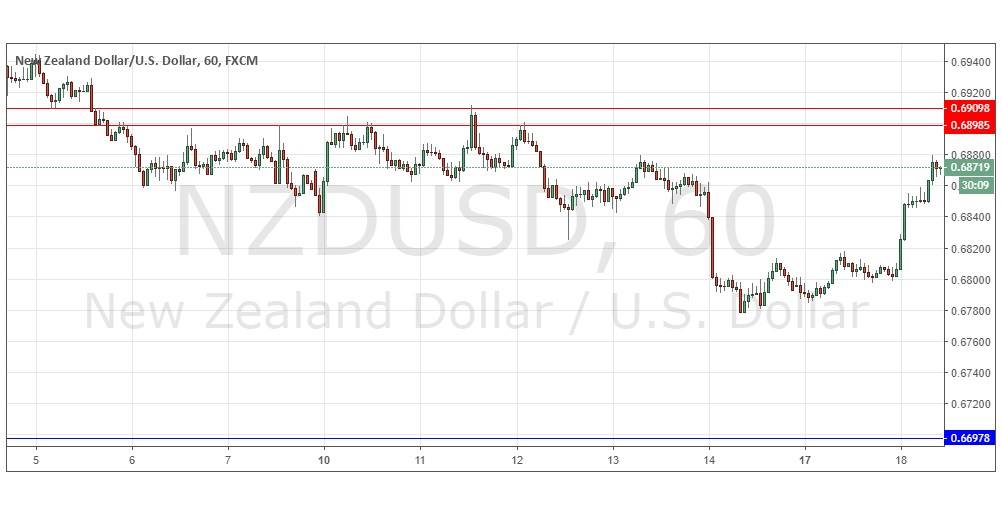
Last Thursday’s signals were not triggered, as none of the key levels were reached.
Today’s NZD/USD Signals
Risk 0.75%.
Trades must be entered between 8am New York time and 5pm Tokyo time, during the next 24-hour period only.
Short Trades
Go short following bearish price action on the H1 time frame immediately upon the next touch of 0.6899 or 0.6910.
Put the stop loss 1 pip above the local swing high.
Adjust the stop loss to break even once the trade is 20 pips in profit.
Remove 50% of the position as profit when the trade is 20 pips in profit and leave the remainder of the position to run.
The best method to identify a classic “price action reversal” is for an hourly candle to close, such as a pin bar, a doji, an outside or even just an engulfing candle with a higher close. You can exploit these levels or zones by watching the price action that occurs at the given levels.
NZD/USD Analysis
I wrote last Thursday that it was now much less clear what was most likely to happen next but the only strong technical feature to watch out for was the cluster of the two resistance levels above. I thought that it was probable that the price would consolidate between 0.6900 and 0.6840 over the next day. This was a good call as it was exactly what happened, but at the end of the week the price broke down strongly before recovering equally strongly this week as the USD began to weaken.
I still see nothing else in the chart to watch out for except the cluster of two resistance levels at about 0.6900, but I would want to see this recent bullish momentum cool off for a few hours before I’d have any confidence in a bearish turn. A slow turn around at 0.6900 would give me a bearish directional bias.
There is nothing important due today concerning either the NZD or the USD.


