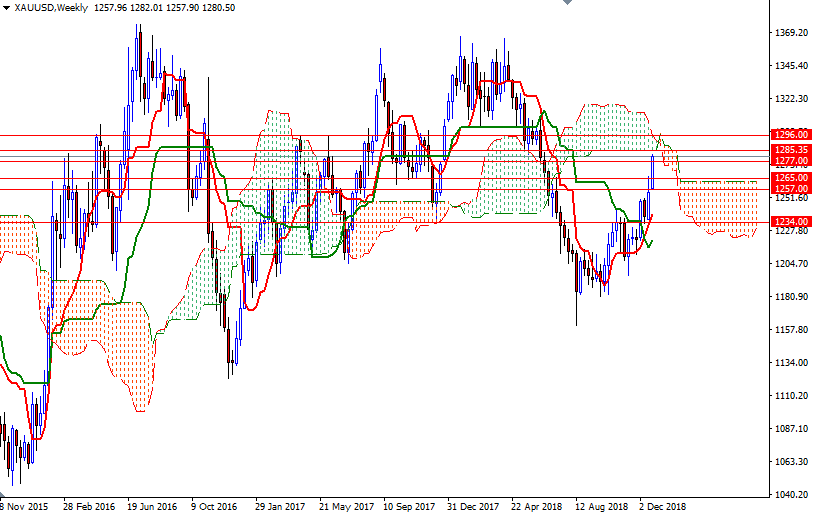
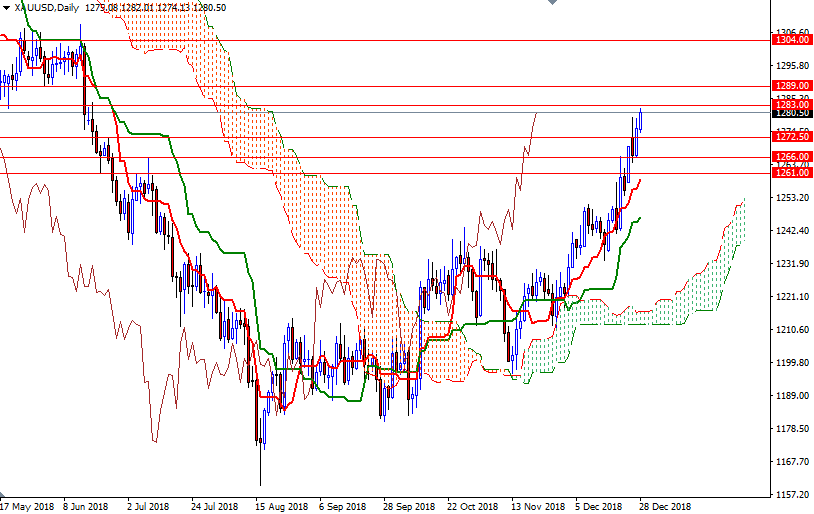
Gold prices ended the week up $22.54 at $1280.50 an ounce, supported by a lower U.S. dollar index and a decline in U.S. Treasury yields. The dollar has been under pressure since Fed policymakers lowered their projections for future rate hikes. Gold also benefited from an improved chart posture and high volatility in the world stock markets. XAU/USD extended its gains after a key technical resistance in the $1266-$1265 zone was penetrated. Gold prices have gained more than 10% after falling in mid-August to their lowest since January 2017 at $1160.05 an ounce, but remain down 2.1% on the year.
The market is trading above the Ichimoku clouds on the daily and the 4-hourly charts. The Tenkan-Sen (nine-period moving average, red line) and the Kijun-Sen (twenty six-period moving average, green line) are positively aligned on the weekly and the daily charts. The Chikou-span (closing price plotted 26 periods behind, brown line) is above prices. The gold market bulls still have technical momentum on their side, but keep in mind that the weekly cloud is sitting just above, occupying the area between the 1285 and the 1296 levels. If XAU/USD passes through the weekly cloud, look for further upside with 1300 and 1307/4 as targets. Beyond there, the 1316/2 area stands out as a solid technical resistance.
To the downside, the initial support sits in the 1272.50-1270 area. A break below 1270 could indicate a move down to test support in 1266/5. The bears need to pull prices below 1265 to gain momentum for 1261/59 and 1257-1255.80. If prices dives below 1255.80, then the market will be targeting 1252/0.


