BTC/USD
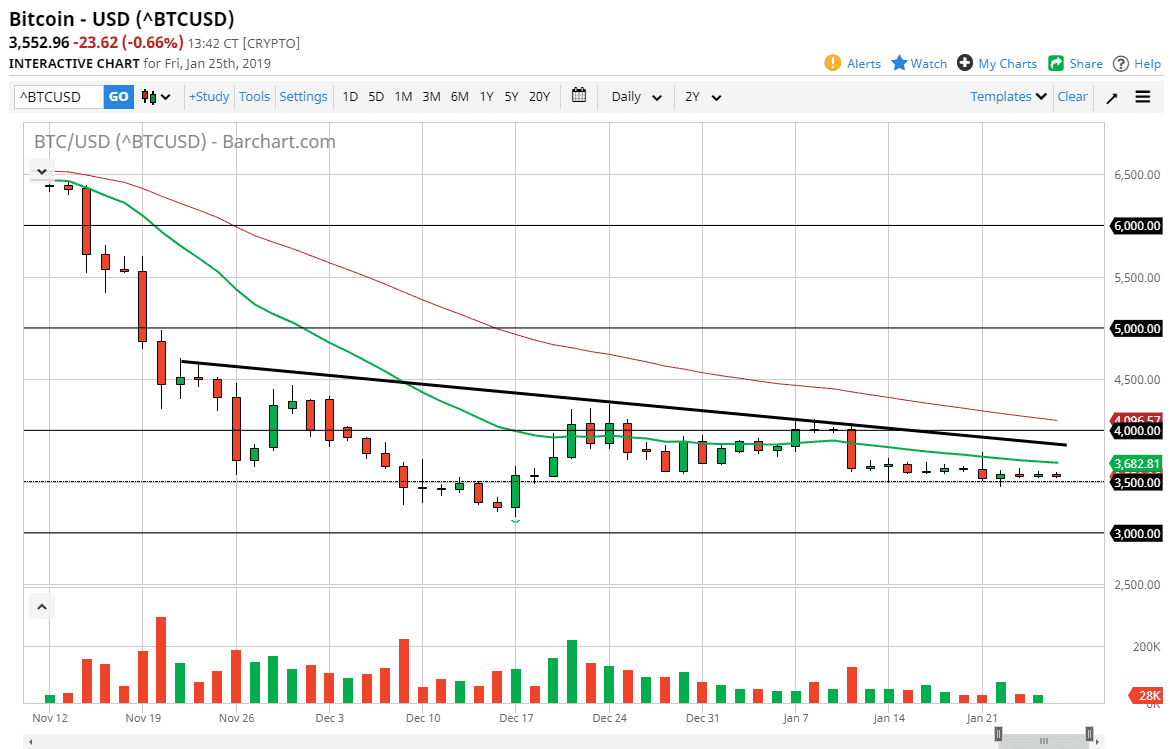
Bitcoin continues to grind sideways overall, as the $3500 level had offered support yet again on Friday. At the same time, the 20 day EMA started to drift even lower during the trading session on Friday, and it continues to offer significant resistance. Above there, the downtrend line offers even more resistance, and the $4000 level beyond that also causes resistance. Even above there we have the 50 day EMA is pointy lower. In other words, there are plenty of reasons to think that traders would come in and sell any rally that shows up. We just had another major ETF withdrawal from SEC consideration, so that’s another problem with the overall bitcoin situation. I do think that the 3500 level is supportive though, so if we can break down below there it could kick off the next move lower.
I think at this point the market will eventually do that, and once we close below the $3500 level we should then go down to the $3000 level. That is a large, round, psychologically significant figure, and an area that has caused a bit of a bounce. I do think that we even get below there given enough time, because quite frankly there is no catalyst to push this market to the upside. I don’t know where the bottom is, but I certainly know we haven’t hit it. We may be entering one of those time frames where the market supply go sideways for quite some time, we have seen it more than once and that of course is the best thing on this chart for the buyers, because we are collapsing in huge moves anymore. That being the case, I think we are getting closer to the bottom than we’ve ever been but we still have further to go.

