Last Thursday’s signals produced a losing short trade following the bearish inside candlestick which rejected the resistance level at $3,593.
Today’s BTC/USD Signals
Risk 0.75% per trade.
Trades must be entered before 5pm Tokyo time today only.
Long Trade
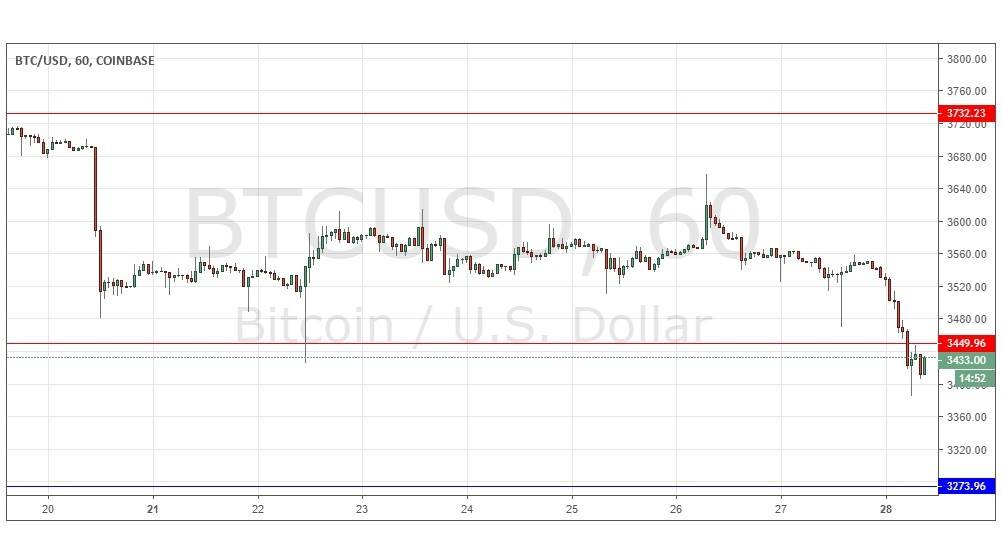
Go long after a bullish price action reversal on the H1 time frame following the next touch of $3,274.
Put the stop loss 1 pip below the local swing low.
Move the stop loss to break even once the trade is $200 in profit by price.
Remove 50% of the position as profit when the trade is $200 in profit by price and leave the remainder of the position to ride.
Short Trade
Go short after a bearish price action reversal on the H1 time frame following the next touch of $3,450.
Put the stop loss 1 pip above the local swing high.
Move the stop loss to break even once the trade is $200 in profit by price.
Remove 50% of the position as profit when the trade is $200 in profit by price and leave the remainder of the position to ride.
The best method to identify a classic “price action reversal” is for an hourly candle to close, such as a pin bar, a doji, an outside or even just an engulfing candle with a higher close. You can exploit these levels or zones by watching the price action that occurs at the given levels.
BTC/USD Analysis
I wrote last Thursday that I would have a slight bias in favour of taking a short trade following a bearish rejection of the nearby resistance over taking a long trade following a bounce at the nearest support level. This scenario did play out, but the trade did not move far enough into profit to end in profit.
The price has stayed quite flat over the past few days but has just broken below a formerly supportive area at $3,450 which now looks likely to hold as resistance. The longer it holds, the more bearish the outlook is likely to be. I have a bearish bias today below $3,450 and above $3,274. There is nothing of high importance due today regarding the USD.

