The difference between success and failure in Forex trading is very likely to depend upon which currency pairs you choose to trade each week, and not on the exact trading methods you might use to determine trade entries and exits. Each week I am going to analyze fundamentals, sentiment and technical positions in order to determine which currency pairs are most likely to produce the easiest and most profitable trading opportunities over the next week. In some cases it will be trading the trend. In other cases it will be trading support and resistance levels during more ranging markets.
Big Picture 27th January 2018
In my previous piece last week, I thought it would be unwise to take any trades as markets generally looked very uncertain.
Last week saw the strongest rise in the relative value of the British Pound, and the strongest fall in the relative value of the U.S. Dollar.
Last week’s Forex market was quite active, dominated by a strong bullish trend in the British Pound, and strong bullishness at the end of the week in precious metals and, to a lesser extent, the New Zealand Dollar. The British Pound is probably strengthening due to an increasing expectation that a “No Deal” Brexit will be avoided as E.U. members begin to focus on the economic damage such an outcome will cause them.
This week is likely to be dominated by the U.S. Dollar as we have a release of the FOMC Statement and Federal Funds Rate plus Non-Farm Payrolls data.
Fundamental Analysis & Market Sentiment
Fundamental analysis remains unclear on the U.S. Dollar. The stock market has continued to recover from its lows but remains a bear market technically. There are major fears over the seeming high sensitivity of the economy to any further rate hikes, as evidenced by the fact that the FOMC appears to have given up on its originally planned further rate hikes for 2019. The ongoing trade dispute with China appears to be moving towards a positive resolution, which is a good sign. A temporary resolution of the U.S. Government shutdown which will reopen the government until 15th February has been agreed which may be helping the U.S. stock market continue its recovery this month.
Public sentiment in the U.K. appears to be hardening on Brexit and attempts by Parliamentary rebels to overturn Brexit appear to be failing. Simultaneously, increasing concern is being voiced within the E.U. over the consequences that countries such as France, Germany, Ireland and Holland will face in the event of a “no deal” Brexit. Paradoxically, this is encouraging the market to believe that a new compromise deal will be offered by the E.U. to the U.K.
The Eurozone got a rather bearish assessment from Mario Draghi in his monthly briefing, in which he noted growth was weakening. This suggests a more bearish outlook for the Euro, although EUR/USD has held up due to Dollar weakness.
Precious metals, especially Gold, look very strong.
Technical Analysis
U.S. Dollar Index
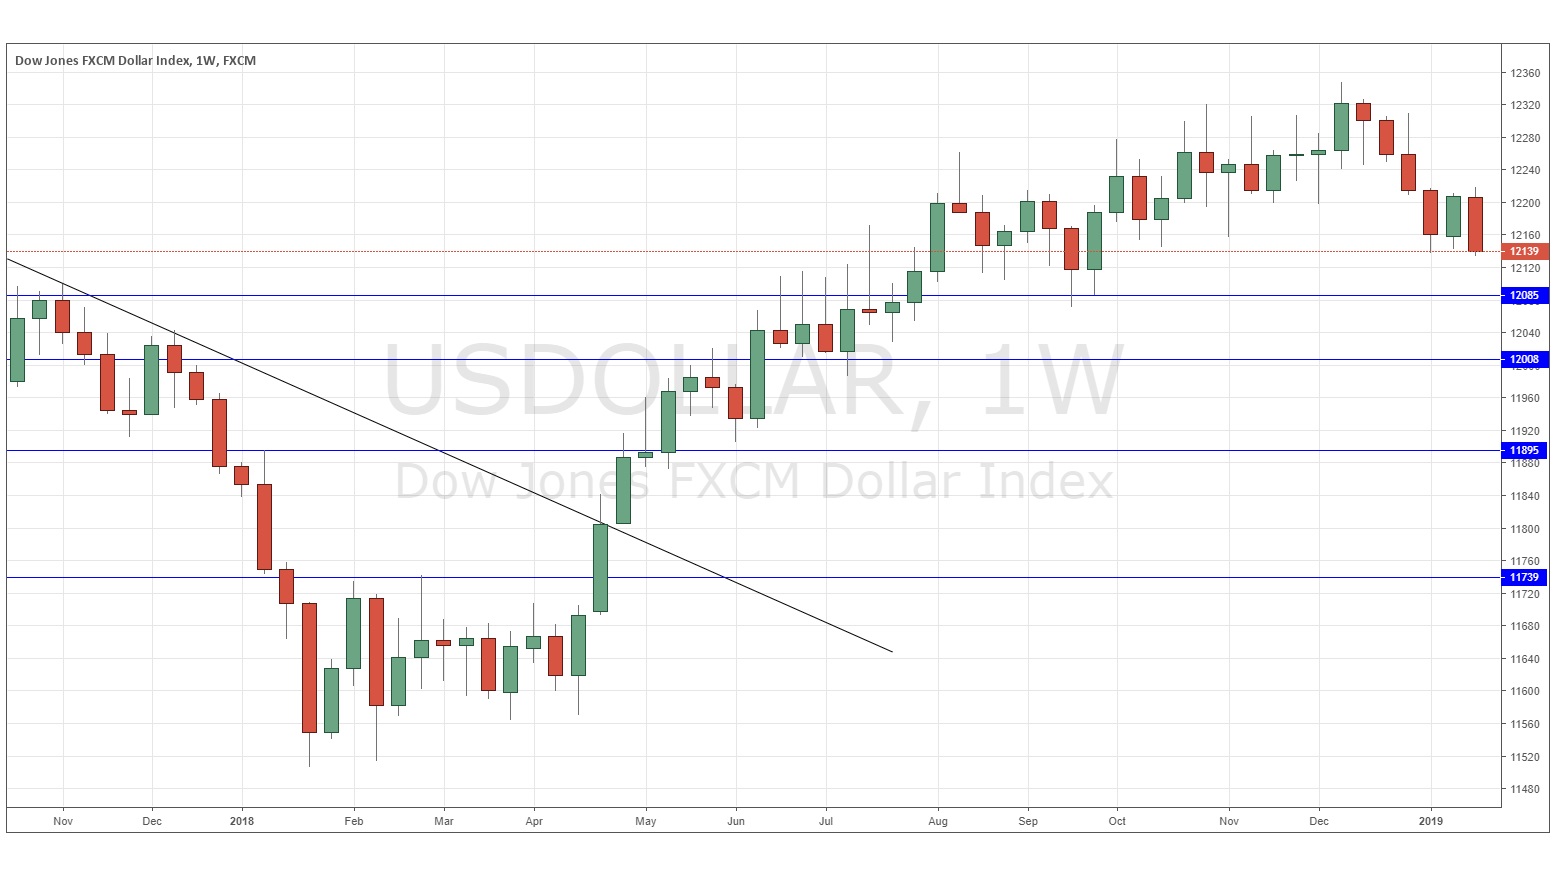
The weekly price chart below shows that last week the USD Index fell quite strongly, printing a bearish outside candlestick that closed very close to its low. The price is down over 3 months, and barely up over 6 months, so we have a more clearly bearish picture. However, the support level below at 12085 has yet to be tested.
GBP/USD
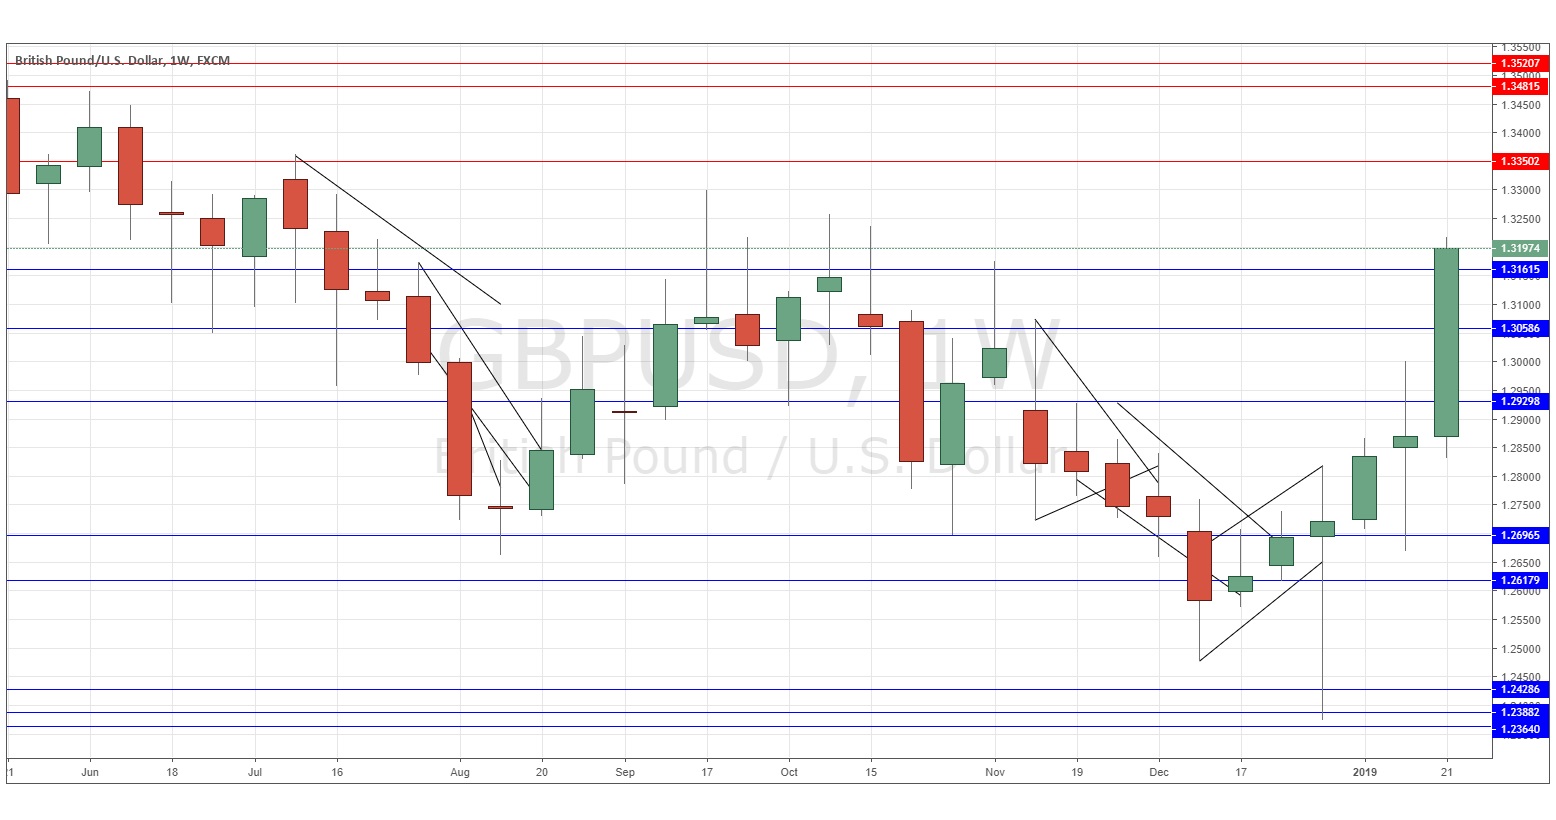
The weekly chart below shows last week produced a very large bullish candlestick which closed very near its high price following the strong bullish movement seen over the past three weeks. The price has made its highest weekly close since July and is now above its levels from both three and six months ago. These are bullish signs and the price does look likely to rise further. However, it is quite possible that 1.3250 will act as resistance, and the Pound of course remains potentially vulnerable to any negative surprises concerning Brexit.
GOLD/USD
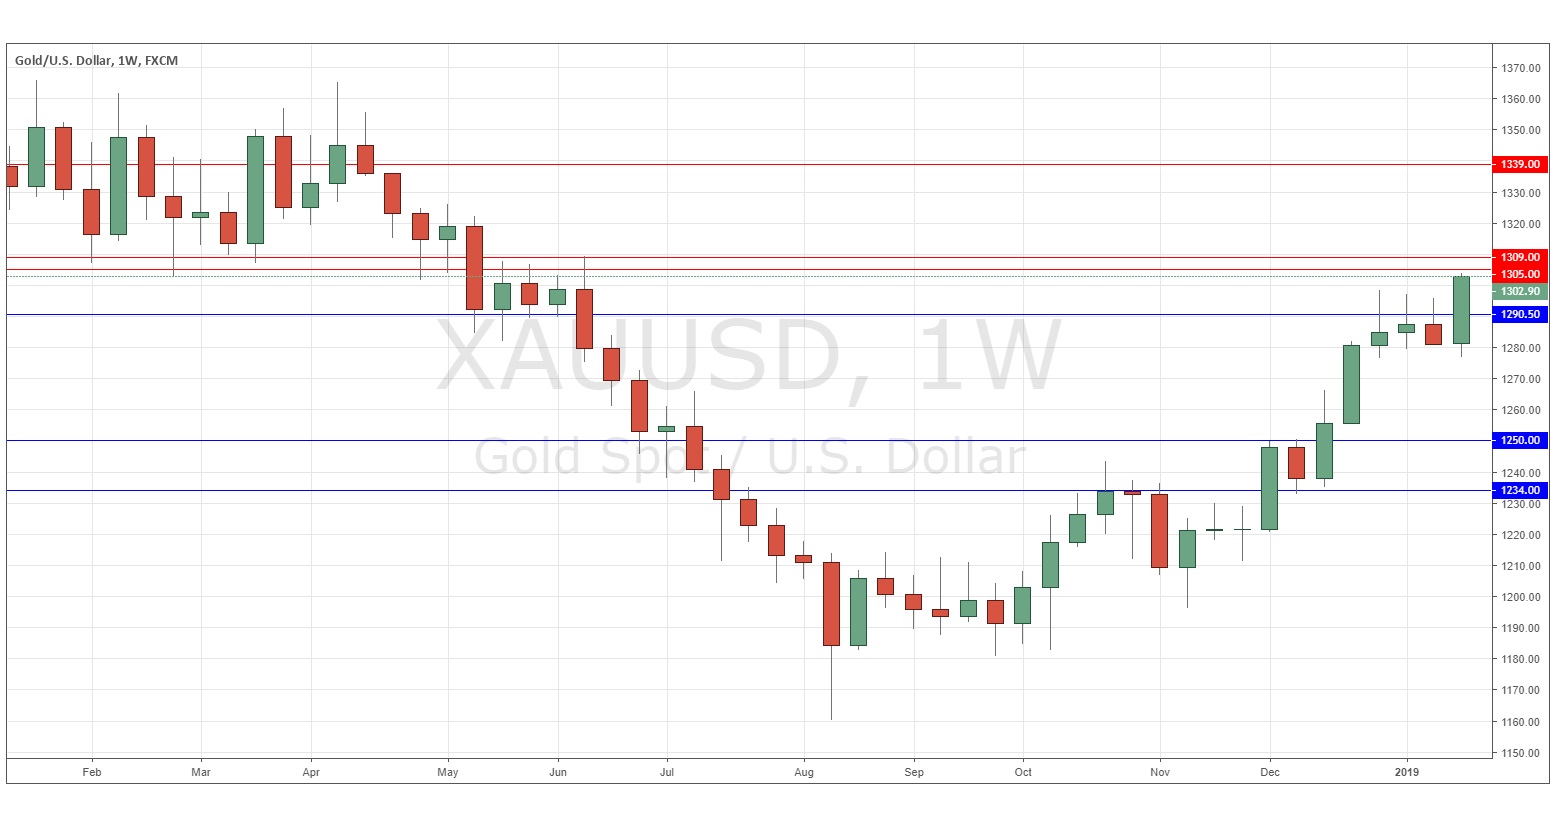
The weekly chart below shows last week produced a large bullish outside candlestick which closed very near its high price following the strong bullish movement seen over the past several weeks. The price has made its highest weekly close since June and is now above its levels from both three and six months ago. These are bullish signs and the price does look likely to rise further. However, it is quite possible that the area at about $1310 will act as resistance, as it is clearly visible in the chart below as a long-term flipping support/resistance area.
Conclusion
Bullish on Gold and the British Pound, bearish on the U.S. Dollar.


