S&P 500
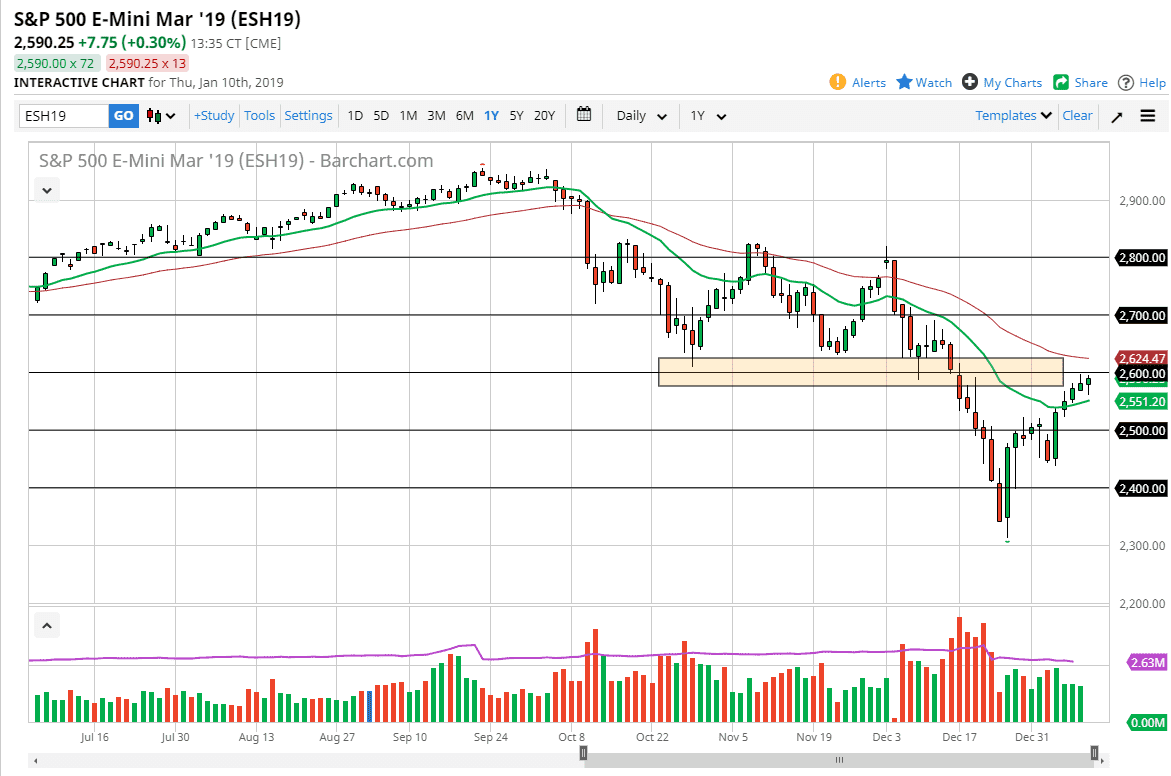
The S&P 500 initially pulled back a bit during the trading session on Thursday, reaching towards the 20 day EMA before turning around and reaching higher again. We ended up forming a bit of a hammer like candle, and we are just below the 2600 level. At this point, I think we are looking at significant resistance above, and of course the 50 day EMA. Signs of exhaustion will be sold through, but if we can close above the 50 day EMA, I am more than willing to start buying. A break down below the 20 day EMA should send this market much lower, perhaps down to the 2500 level. It certainly looks very bullish at this point but that barrier is significant to say the least. With that in mind, I think that you can expect a lot of volatility over the next couple of days.
NASDAQ 100
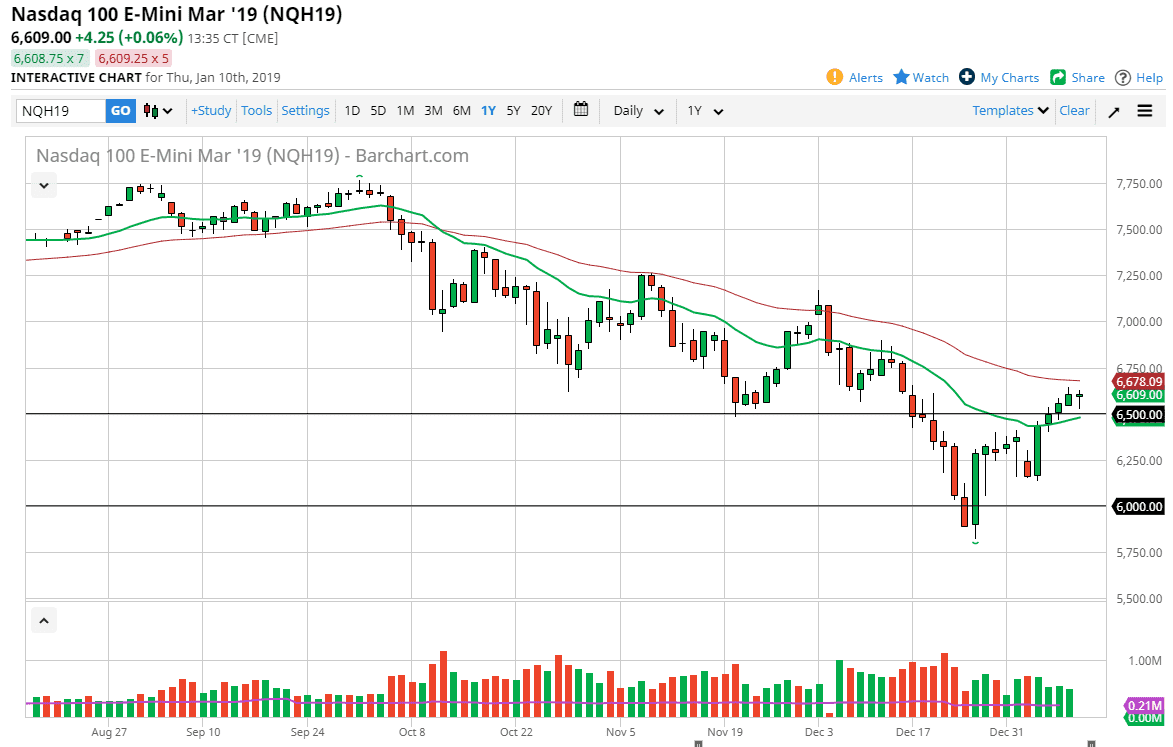
NASDAQ 100 traders initially sold during the trading session on Thursday but found enough support near the 6500 level to turn things around and form a hammer. The hammer of course is a bullish sign so I think that reaching towards the 50 day EMA seems likely. If we can break above there, the market should continue to go higher, maybe as high as 7000. This market will be highly sensitive to the US/Chinese trade situation, so it’s obvious that we will be moving with headlines. At this point though, it looks like we are taking a bit of a breather although it looks as if the 6500 level is going to offer a reasonable amount of support. I think that short-term traders will continue to go back and forth in this area before breaking through one of the two moving averages I have been on the chart.


