S&P 500
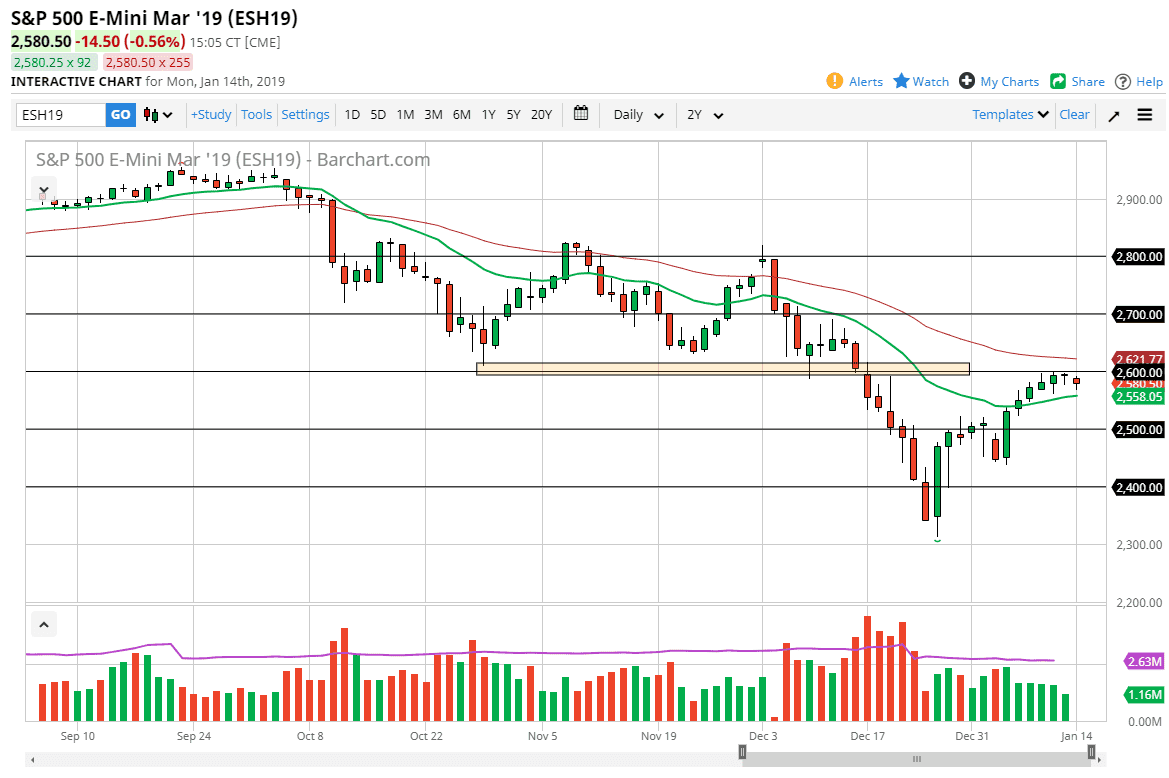
The S&P 500 fell a bit during the trading session on Monday but has found a bit of support at the 20 day EMA. The market is currently caught between the 20 day EMA pictured in green, and the 50 day EMA pictured in red. The market looks very likely to go back and forth and perhaps try to build enough momentum to make a serious move. I believe that the 2600 level is going to continue to cause a lot of issues though, as it was previous support, and it should now be massive resistance. I think a daily close above the 50 day EMA should send this market towards the 2700 level. Alternately, a daily close below the 20 day EMA could send this market down to the 2500 level. I believe that this market has a lot of volatility ahead of it.
NASDAQ 100
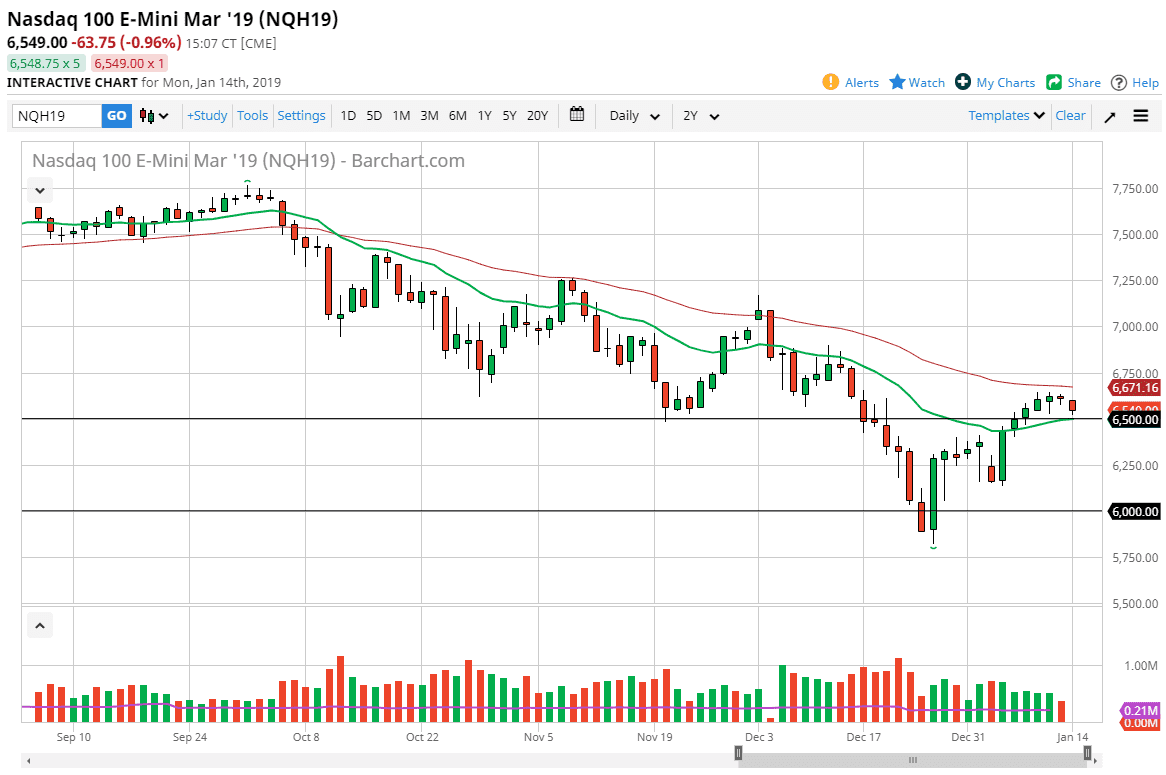
The NASDAQ 100 also is caught between the 20 day EMA and the 50 day EMA. We are sitting above the 6500 level, an area that of course will attract a lot of attention, so we break down below it, and subsequently the 20 day EMA, the market should then roll over to the 6250 handle. If we break above the 50 day EMA, then we could go as high as the 7000 handle, but I think this is all going to come down to both earnings season and the US/China trade negotiations. With that being the case, I think it’s purely a play on emotion right now, and whenever you get these type of situations it’s very likely that we continue to see a lot of choppy. I would suspect that we will make a sudden and decisive move in the next couple of days though.


