USD/CHF
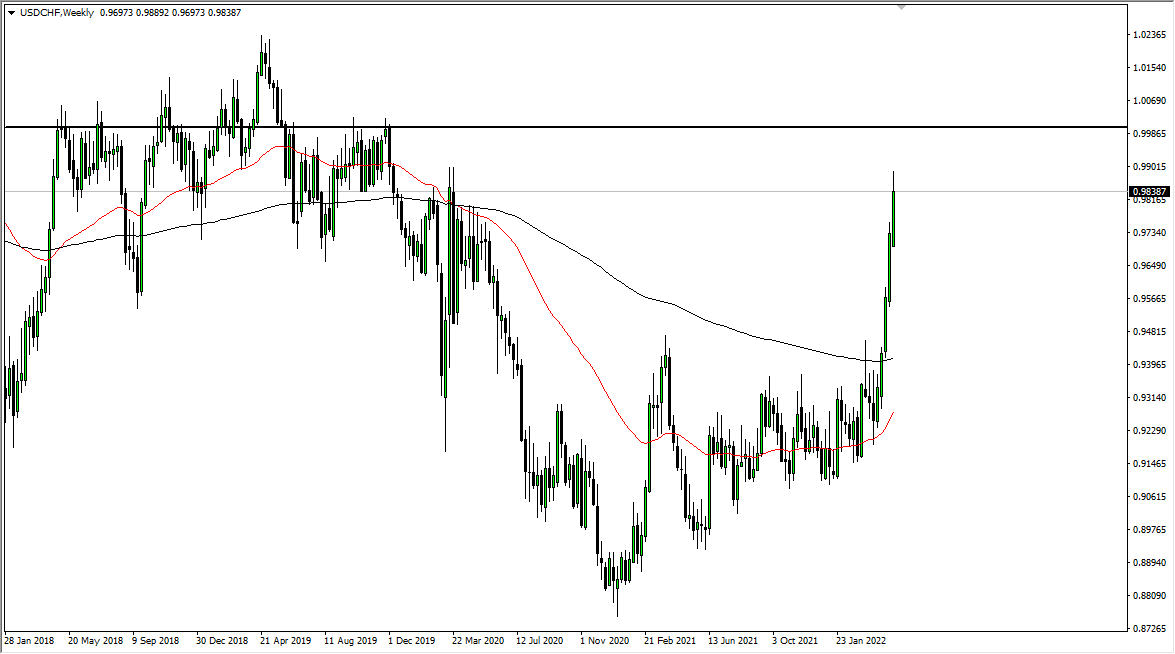
The US dollar has fallen a bit during the week but turned around to form a massive hammer. That’s a good sign, as we continue to hang around the 52 EMA on the weekly chart. Looking at this chart, it looks as if we could rally from here and go looking towards parity. However, if we were to turn around and break down below the 0.9750 level, this would be a horribly negative sign. The way things are looking here though, I do think that we get a little bit of a rally this week.
USD/JPY
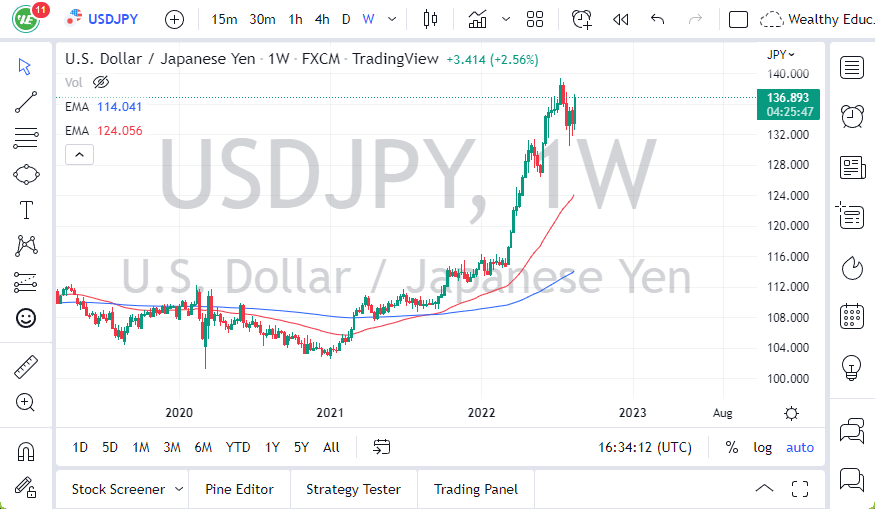
The US dollar has gone back and forth against the Japanese yen, forming a very neutral looking candle for the week. This suggests to me that we are going to continue to see a lot of volatility, with the ¥108 level being supported. I believe that the ¥109 level is resistance, so is very likely that we will see a lot of back-and-forth and noisy behavior. However, if we break above the ¥109 level, then we go looking towards the ¥110 level. On the other hand, if we break down below the low of the weekly candle stick, then I think we could drop down to the 100 section level.
USD/CAD
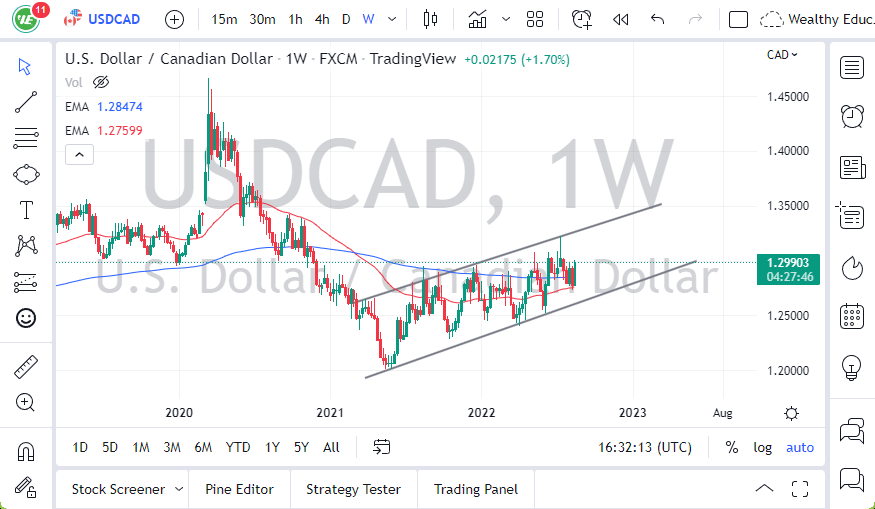
The US dollar has fallen during the week, slicing through the 1.3250 level. However, we turned around to rally above there and we are starting to see the 52 week moving average turn around and show signs of strength again. At this point, I think that short-term pullbacks continue to offer some bullish opportunities for those who are trying to take advantage of the trend. Pay attention to oil though, because if it breaks out to the upside we will probably continue to go down to the 1.30 level.

EUR/USD
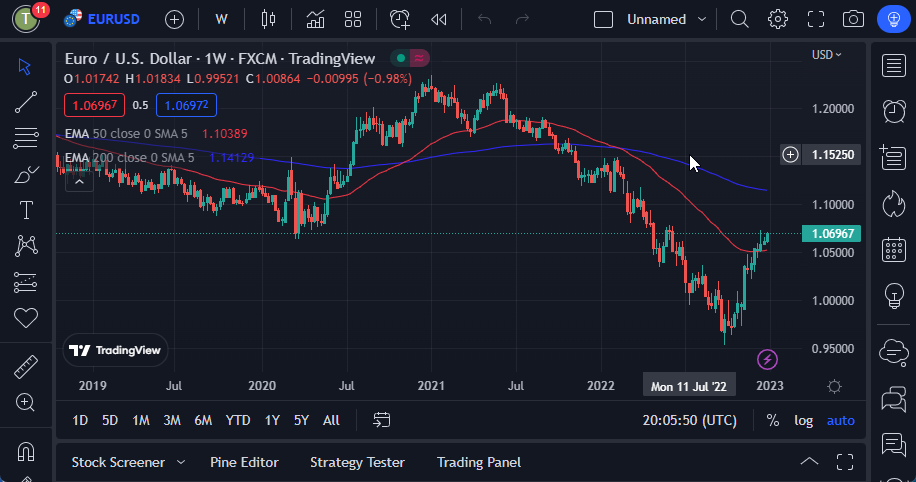
The Euro rallied significantly during the week but then found resistance above the 1.15 handle. Because of the shape of the candle stick, I think we are going to continue to go back and forth just below the 1.15 handle. However, I think there is plenty of support as well, so expect choppy behavior and lots of noise in this area. I think it’s going to be very difficult trading, so you short-term range bound systems.


