WTI Crude Oil
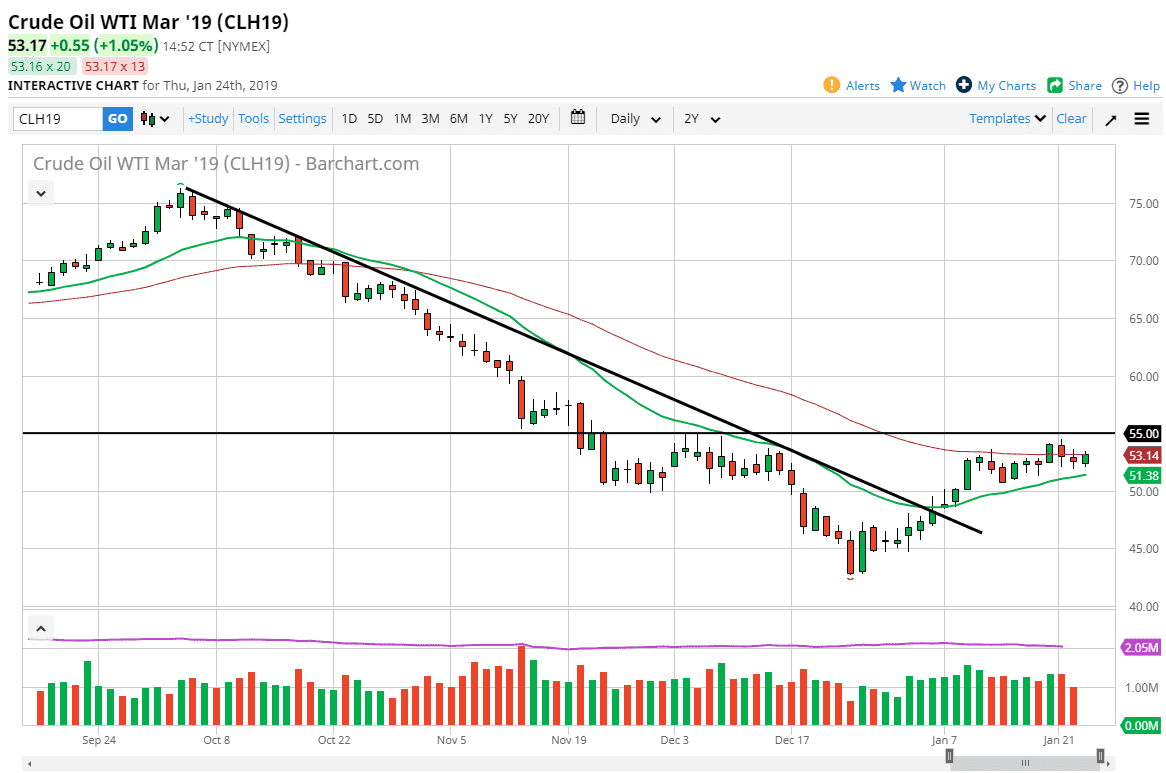
The WTI Crude Oil market has rallied a bit during the trading session on Thursday, as we continue to bounce between the 20 and the 50 day EMA indicators. By going sideways, we have shown resiliency that is a bit surprising considering that the EIA reported that there were was an increase of 8 million barrels to US inventory. That is a very negative sign, but at this point the market refuses to drop. I think what we are waiting on is whether we can break above the $55 level. If and when we do, that releases the market to go much higher, perhaps adding to the $57.50 level, and then the $60 level after that. In fact, I believe that we are in the process of trying to form an “inverse head and shoulders.”
Natural Gas
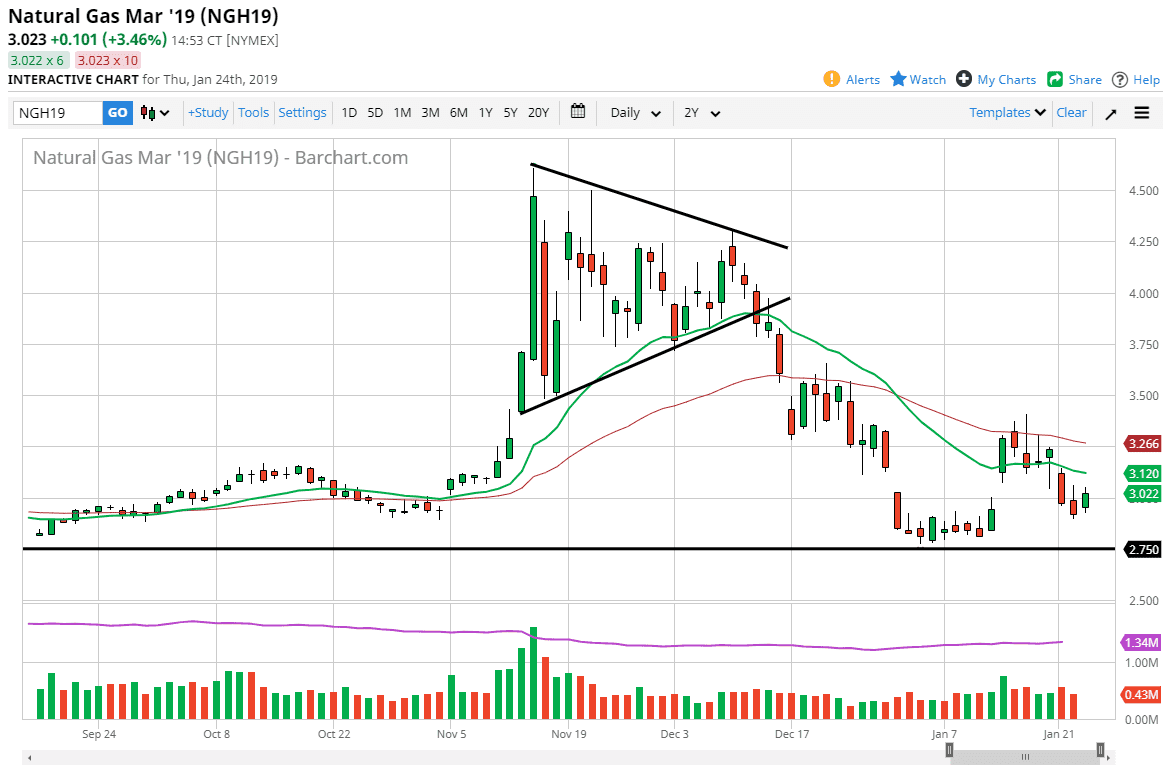
Natural gas markets rallied a bit during the trading session on Thursday, breaking above the $3.00 level, showing signs of resiliency again. That being said, I believe the 20 day EMA above, pictured in green on the chart, will cause a bit of resistance. Beyond that, the 50 day EMA is above there I think it should be a selling opportunity as well. Natural gas is oversupplied, and I have no interest in trying to buy this commodity as it is difficult to imagine prices rising for any significant amount of time. I look for rallies that show signs of exhaustion that we can sell, as I believe that the ceiling now is that the $3.50 level above. I do recognize that the $2.75 level underneath is massive support, so a break down below there would really get the downside moving. I believe that fading short-term rallies for small trades will be the best way to play this market.


