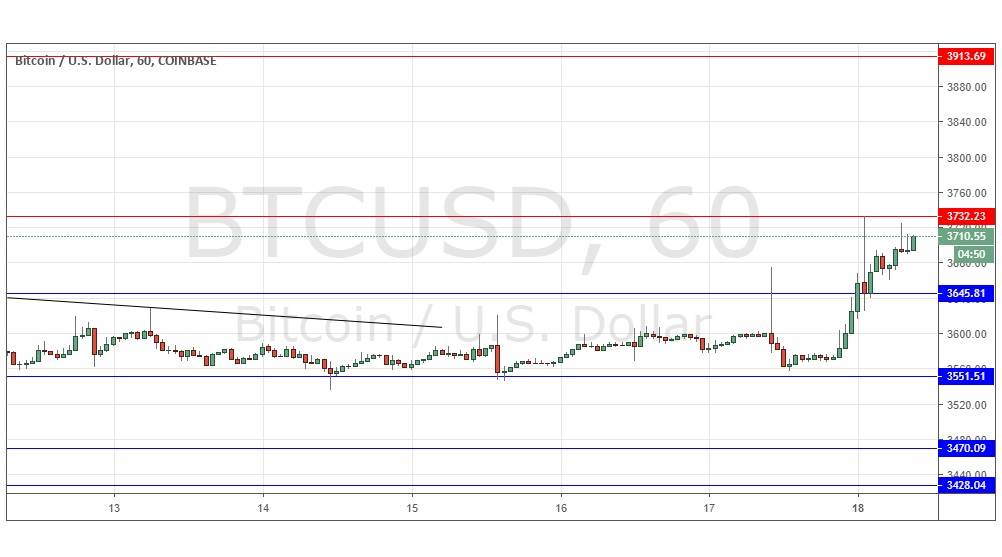
Last Thursday’s signals were not triggered, as the bullish price action took place just below the support level identified at $3,557.
Today’s BTC/USD Signals
Risk 0.75% per trade.
Trades must be entered before 5pm Tokyo time Tuesday.
Long Trades
Go long at a bullish price action reversal on the H1 time frame following the next touch of $3,646, $3,552, $3,470, or $3,428.
Place the stop loss 1 pip below the local swing low.
Adjust the stop loss to break even once the trade is $50 in profit by price.
Take off 50% of the position as profit when the trade is $50 in profit by price and leave the remainder of the position to run.
Short Trades
Go short after a bearish price action reversal on the H1 time frame following the next touch of $3,732 or $3,914.
Place the stop loss 1 pip above the local swing high.
Adjust the stop loss to break even once the trade is $50 in profit by price.
Take off 50% of the position as profit when the trade is $50 in profit by price and leave the remainder of the position to run.
The best method to identify a classic “price action reversal” is for an hourly candle to close, such as a pin bar, a doji, an outside or even just an engulfing candle with a higher close. You can exploit these levels or zones by watching the price action that occurs at the given levels.
BTC/USD Analysis
I wrote last Thursday that the the bulls and bears seemed to be evenly balanced. This was a reasonably good call as the price went sideways over the rest of that day within a narrow price band. Recent hours have seen a change of tone with a relatively strong bullish push breaking up past former resistance though so far, the move has been held by the resistance at $3,732 which looks likely to be today’s crucial pivotal level. If the price can trade above that level for a couple of hours later today, I would take a bullish bias as we would then be likely to see further upwards movement, with enough empty space stretching all the way to $3,914. Concerning the USD, it is a public holiday in the U.S.A.

