The difference between success and failure in Forex trading is very likely to depend upon which currency pairs you choose to trade each week, and not on the exact trading methods you might use to determine trade entries and exits. Each week I am going to analyze fundamentals, sentiment and technical positions in order to determine which currency pairs are most likely to produce the easiest and most profitable trading opportunities over the next week. In some cases it will be trading the trend. In other cases it will be trading support and resistance levels during more ranging markets.
Big Picture 10th February 2018
In my previous piece last week, I had no clear bias on anything. I did highlight possible long Gold and long GBP/USD trades
Last week saw the strongest rise in the relative value of the U.S. Dollar, and the strongest falls in the relative values of the Swedish Krona and Australian and New Zealand Dollars.
Last week’s Forex market was more active, dominated by a bullish recovery in the U.S. Dollar while the Japanese Yen was also strong. Attention is shifting back to the U.S.A. as the issues of the Government shutdown and a possible trade deal with China again come to the fore.
This week is likely to be dominated by crucial data on the U.S. Dollar and British Pound, as well as the monthly central bank input for the New Zealand Dollar. There is also continuing political speculation over whether Brexit will happen as scheduled on 29th March, and the detailed economic terms of the departure.
Fundamental Analysis & Market Sentiment
Fundamental analysis remains unclear on the U.S. Dollar. The stock market has continued to recover from its lows but remains a bear market technically. There are major fears over the seeming high sensitivity of the economy to any further rate hikes, as evidenced by the fact that the FOMC appears to have given up on its originally planned further rate hikes for 2019. The ongoing trade dispute with China appears to be moving towards a positive resolution, which is a good sign. A temporary resolution of the U.S. Government shutdown which will reopen the government until 15th February has been agreed which may be helping the U.S. stock market continue its recovery this month.
Public sentiment in the U.K. appears to be hardening on Brexit and attempts by Parliamentary rebels to overturn Brexit appear to be failing, but they are readying for another push which will be helped by the very hard, hostile line which is being taken by the European Union against the U.K. However, increasing concern is being voiced within the E.U. over the consequences that countries such as France, Germany, Ireland and Holland will face in the event of a “no deal” Brexit.
The ECB has recently taken a more dovish line on the Euro and the Euro weakened last week. The Swedish Krona is also very weak, hitting new 2-year lows on a strong bearish breakdown against the U.S. Dollar, as fears mount over the significance of data indicating a deterioration in the Swedish economy.
Precious metals, especially Gold, still look strong.
Technical Analysis
U.S. Dollar Index
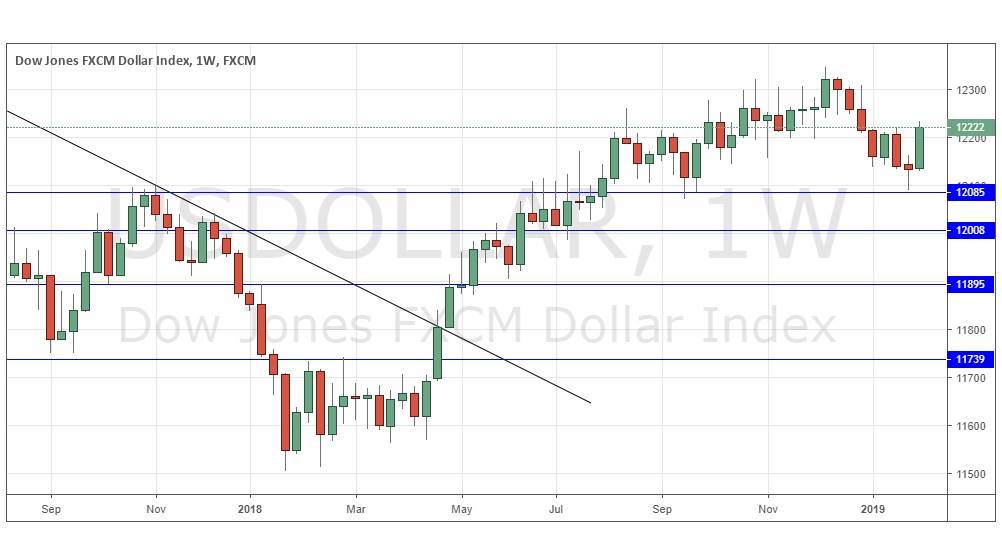
The weekly price chart below shows that last week the USD Index rose strongly, printing a bullish engulfing candlestick following last week’s low which was very close to the support level identified at 12085. The price is down over 3 months, but up over 6 months, so we have a more mixed picture on the Dollar. The candlestick closed very near its high which is perhaps a bullish sign for the coming week.
USD/SEK
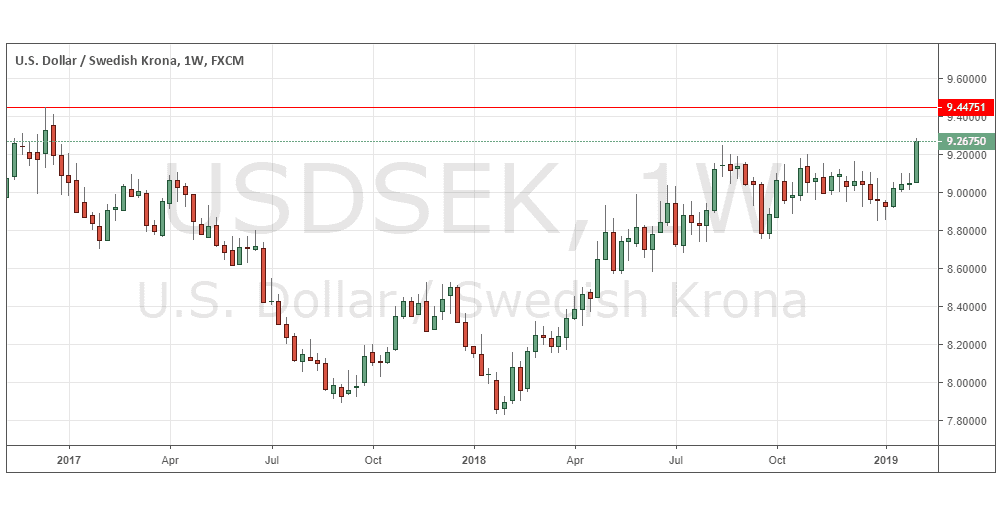
The weekly chart below shows last week produced a very large, strongly bullish candlestick, which reached and closed at a 2-year high. The chart shows there is clearly a long-term trend, and last week’s movement was a strong breakout from a consolidation area. Statistics suggest that the odds are wish a further rise over the coming week, but traders should be careful to protect themselves against the high volatility which could week be expressed next week in a sudden and very strong bearish pullback. Bulls should also beware of the all-time high not far above at 9.4475.
GOLD/USD
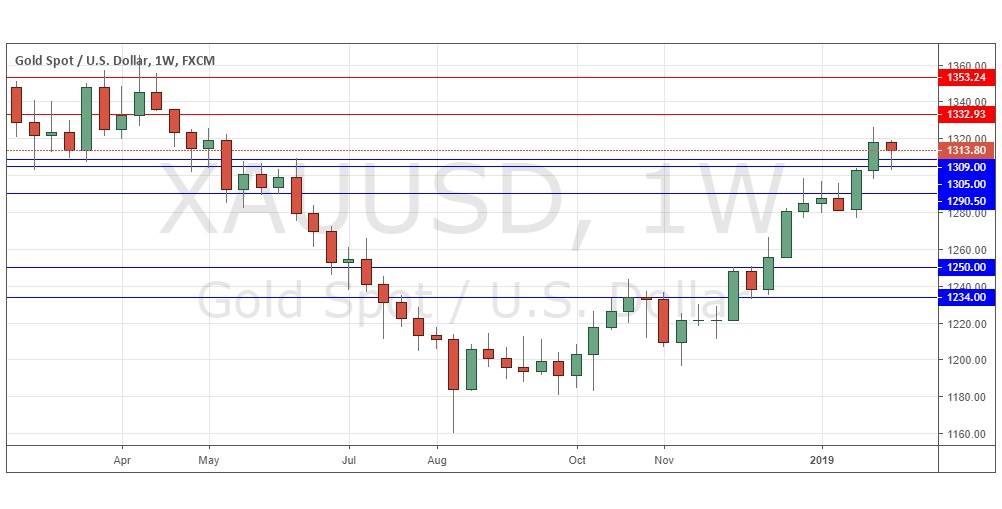
The weekly chart below shows last week gave a generally indecisive inside candlestick, which is perhaps slightly bullish. The long-term bullish trend and nearby support levels are intact, suggesting we may well see higher prices still. However, there is no evidence that bulls should get overly excited just yet. There is resistance not far above at $1332.93.
Conclusion
This week I am bullish on the U.S. Dollar and bearish on the Swedish Krona.


