S&P 500
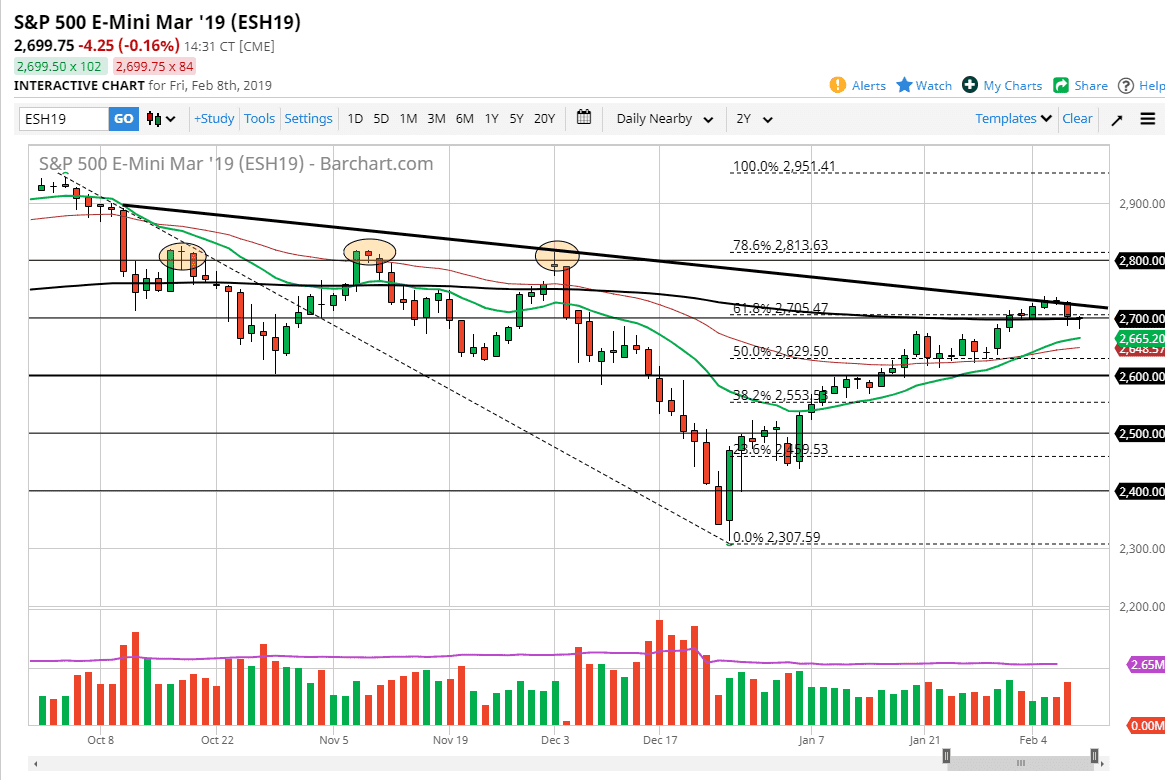
The S&P 500 initially fell during the day on Friday but turned around to bounce a bit as we closed near the 2700 level. This is a market that does look a bit suspiciously resisted just above, and we do have the 200 day EMA right here where we currently trade. Beyond that, there is the 61.8% Fibonacci retracement level at the 2700 level, so the fact that we are forming a bit of a shooting star on the weekly chart also throws a lot of doubt into this uptrend. However, if we can clear the candle stick from the Thursday session to the upside, it’s likely that we will continue going higher. I anticipate that this market is going to continue to be choppy overall. With that in mind, I am going to stay on the sidelines until we get an impulsive candle to tell us which direction we are going.
NASDAQ 100
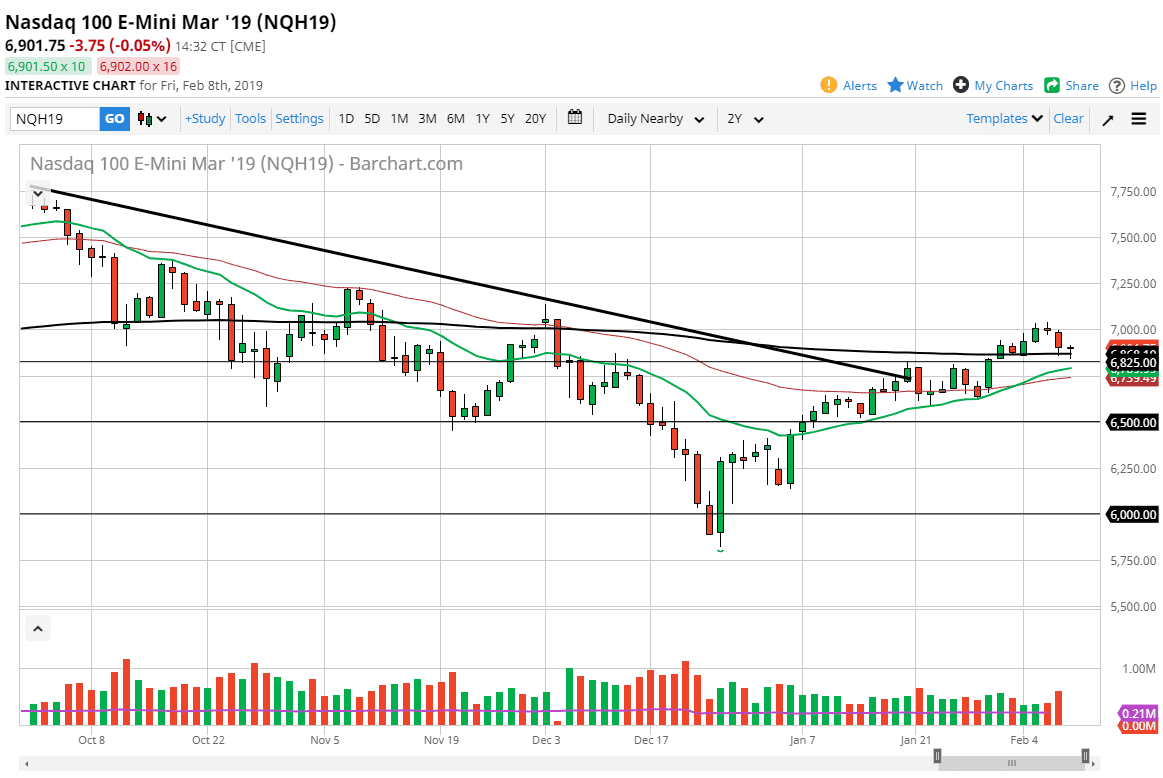
The NASDAQ 100 pulled back a bit during the day on Friday, forming support at the 200 day EMA and then bounced enough to form a hammer. At this point, it looks well supported but there are a lot of concerns out there that could continue to press upon the market. The weekly candle stick is a shooting star, but the previous week was a hammer. Ultimately, we also have the shooting star on the weekly chart for the S&P 500 so I think we are going to continue to see a lot of confusion. Both of these markets beg to be ignored right now, and simply observed more than anything else. Some type of impulsive candle is needed to bring some clarity into this market, so keep your powder dry.


