WTI Crude Oil
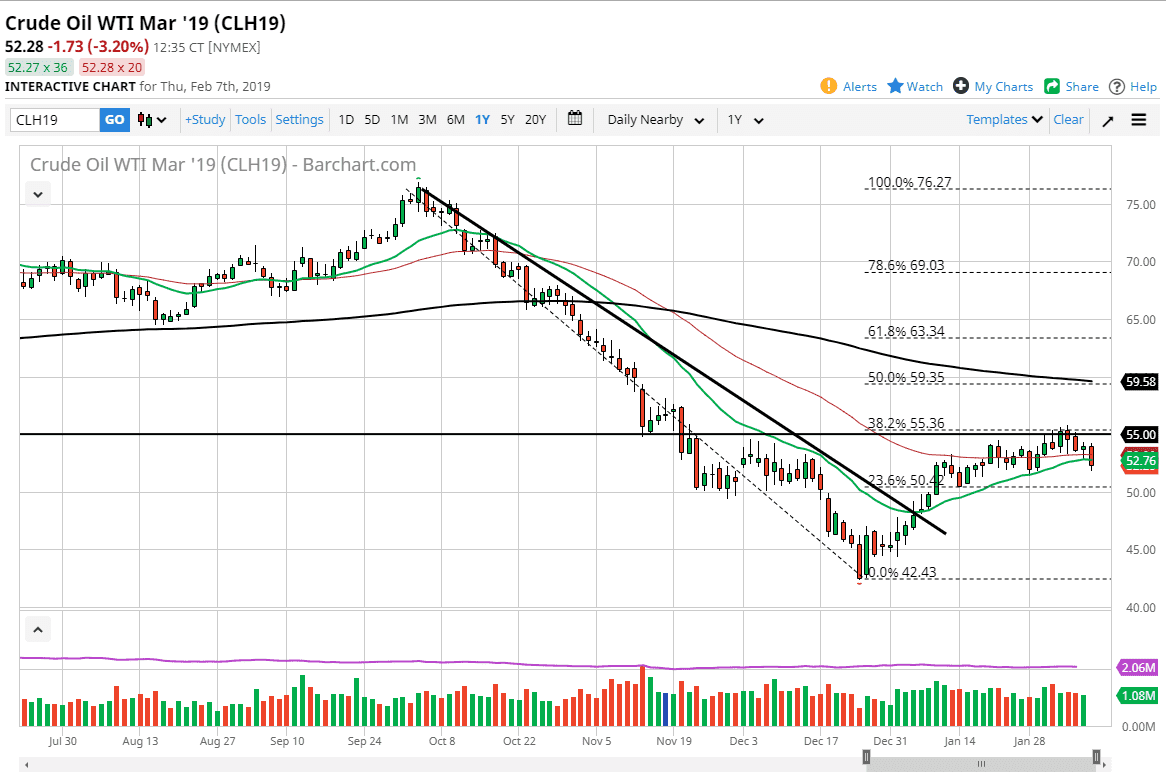
The WTI Crude Oil market fell significantly during the trading session on Thursday, slicing through the 20 day EMA and the 50 day EMA. That’s a very negative sign, but there is a certain amount of support underneath. I believe that the $50 level underneath will be a bit of a “floor” in the market, but if we were to break down below there it could change everything. This candlestick could be the beginning of something negative going forward, and it appears that the sellers are starting to take over a little bit. At this point, I think that we are still grinding sideways in general, but it’s starting to look a little less in the way of bullish as this candlestick has done some technical damage. At this point, the $50 level must hold for any attempt to rally can be taken seriously. I’d be on the sidelines for Friday.
Natural Gas
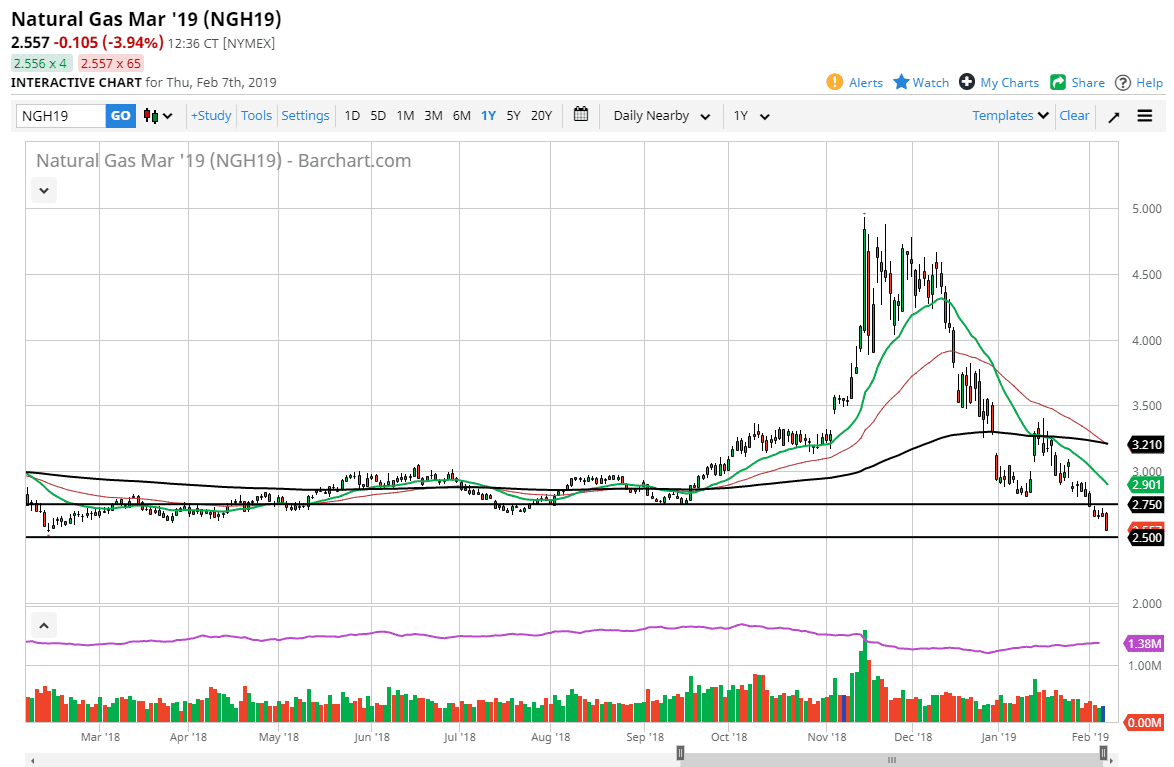
Natural gas markets fell significantly during the trading session on Thursday, reaching down towards the $2.50 level, an area that is massive support on longer-term charts. I’m looking for an opportunity to short this market but chasing the trade isn’t what I want to do. We will get some type of relief rally but it may be days, if not a few weeks before we get an opportunity to sell at a reasonable price.
The $2.90 level is where the 20 day EMA is currently trading at, and I think that the market showing signs of exhaustion should be an opportunity to get short. If we break above there, then the market probably goes looking towards the $3.00 level, possibly even the $3.20 level. Either way, I’m not willing to buy this market and I simply wait for an exhaustive daily candle to start shorting again.


