BTC/USD
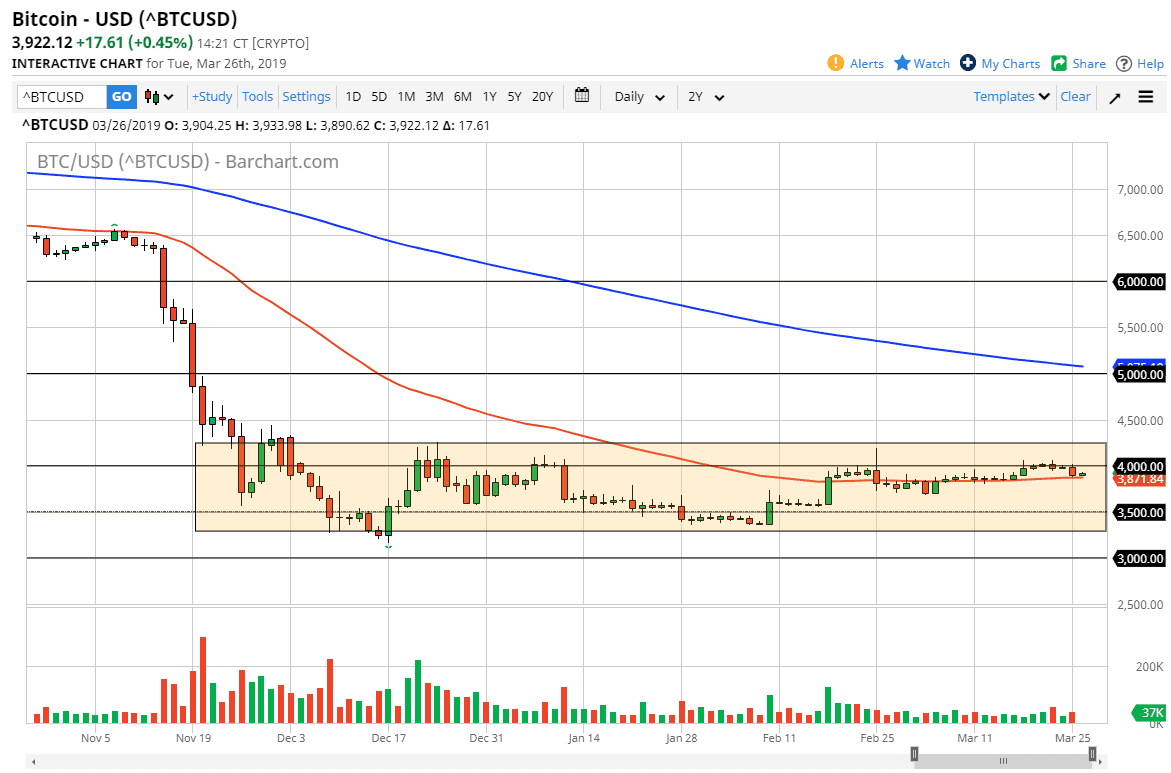
Bitcoin rallied slightly during the trading session on Tuesday, as we are sitting above the 50 day EMA. The 50 day EMA has been important over the last couple of weeks, and now seems to be the battleground in which buyers and sellers are fighting. With that in mind, you should pay attention to the fact that the 50 day EMA is starting to grind higher, which is a bullish sign.
Looking at this chart, it appears that we are trying to form some type of base for a longer-term move. This doesn’t mean that we are going to go straight up, but right now it appears that we are simply consolidating between the $4250 level on the top, with the $3250 level on the bottom. With that being the case, it makes sense that we will continue to see a lot of back-and-forth trading.
I believe that longer-term traders are starting to pick up Bitcoin on dips, and if you can scale into a position, this might be the buying opportunity that you have been looking for. On the other hand, if you are a shorter term trader, then you recognize that we have a supported and a resistance level from which to trade off of. It really comes down to your timeframe, but I do think that a lot of the longer-term believers are accumulating down at these lower levels.
If the thesis of a base is true, we don’t know how long it lasts, but a break above the $4250 level would be the first sign that we are going to go much higher. Initially, I think the market will go looking towards the $5000 handle. However, when that happens I simply cannot answer. The alternate scenario is that we break down below the $3000 level, which I think would be somewhat catastrophic.

