Gold
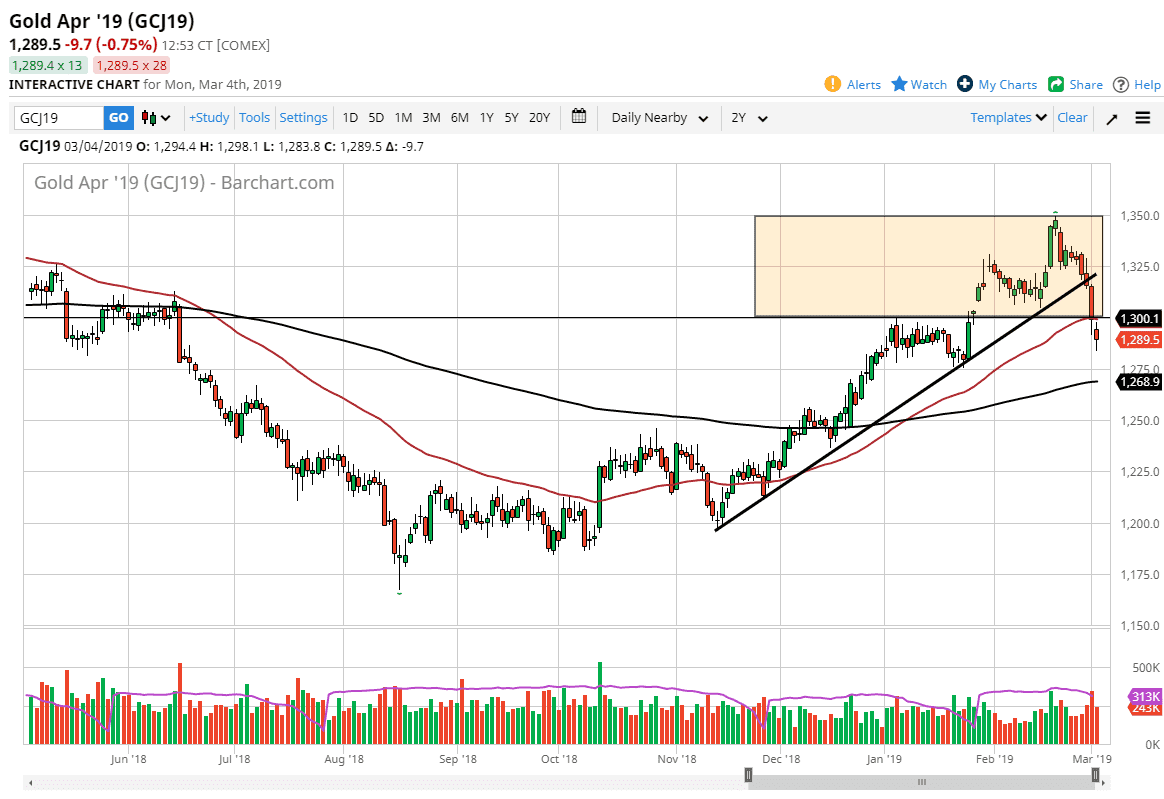
Gold markets gapped lower to kick off the trading session on Monday, as we continue to see selling pressure. Looking at this chart, we broke down below the $1300 level and then gapped lower again to kick off the trading session. The 50 day EMA is above, so now that we have turned around to reach towards that level and then sell all, that’s a very bullish sign. Because of this chart, it looks very likely that we will continue to reach towards the $1275 level underneath as it was a major support and a place where we had tested the uptrend line and clustered. Gold tends to have a lot of interest every $25, so it makes sense that we would revisit that level.
Beyond that, the 200 day EMA sits just below there, which of course will be technically important for a lot of longer-term traders as well. The market looks very likely to attract a lot of attention at that point, so it will be very interesting to see how it reacts. Regardless, I do think that we may be ready to fall at this point even further, because it is a larger consolidation area that extends all the way down to the $1200 level. That being said, we must pay attention to the 200 day EMA in order to decide which side of the market we want to be on. A hammer at that level would be an excellent buying opportunity. However, if we get an impulsive candles to the downside of that moving average, I would be piling on was short positions.

