S&P 500
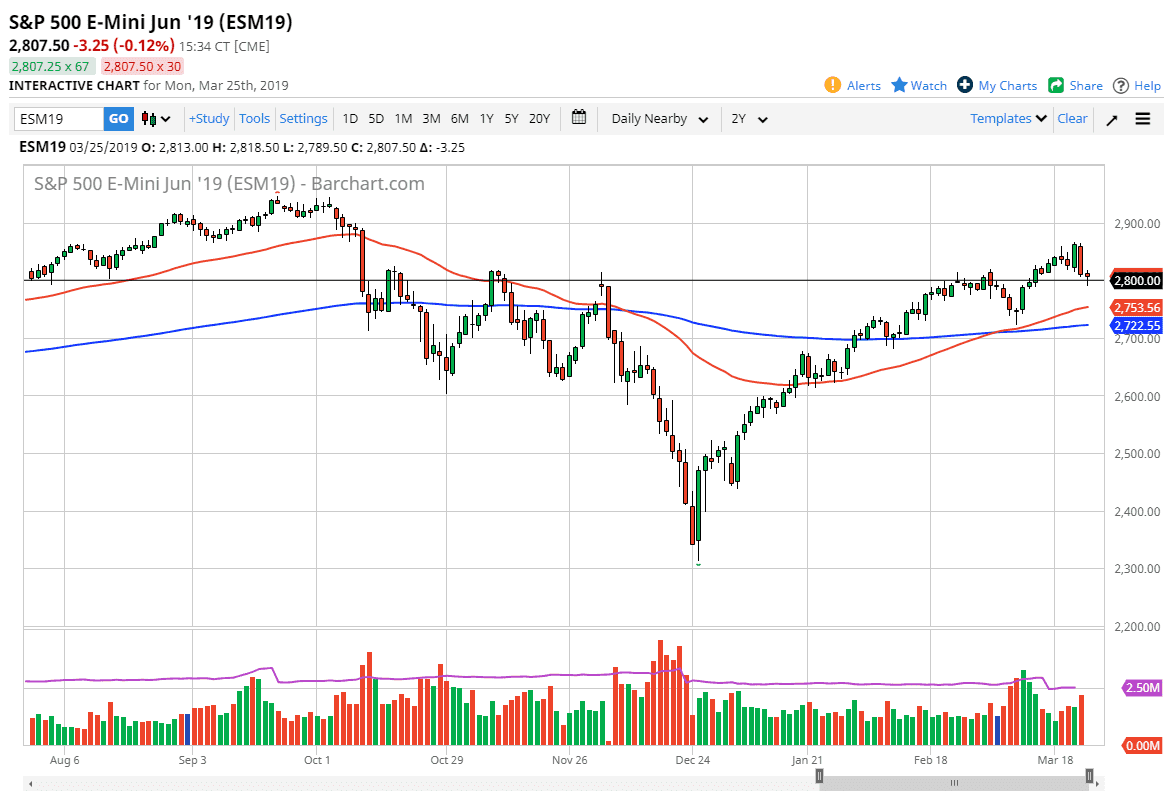
The S&P 500 fell significantly during the trading session on Monday initially, but then turned around to form a very bullish close for the day. The fact that we bounced enough to form a hammer suggests that we are ready to continue to try to grind to the upside. This was a very bullish sign and breaking above the top of the candle stick should send the market looking for the highs from the previous session. This of course was formed around the 2800 level which of course also attracts a lot of attention by itself. With that, it looks as if the longer-term trend still is very much intact even after the scare on Friday. Looking at the chart, if we were to break down below the bottom of the hammer, then we could drop down to the 50 day EMA.
NASDAQ 100
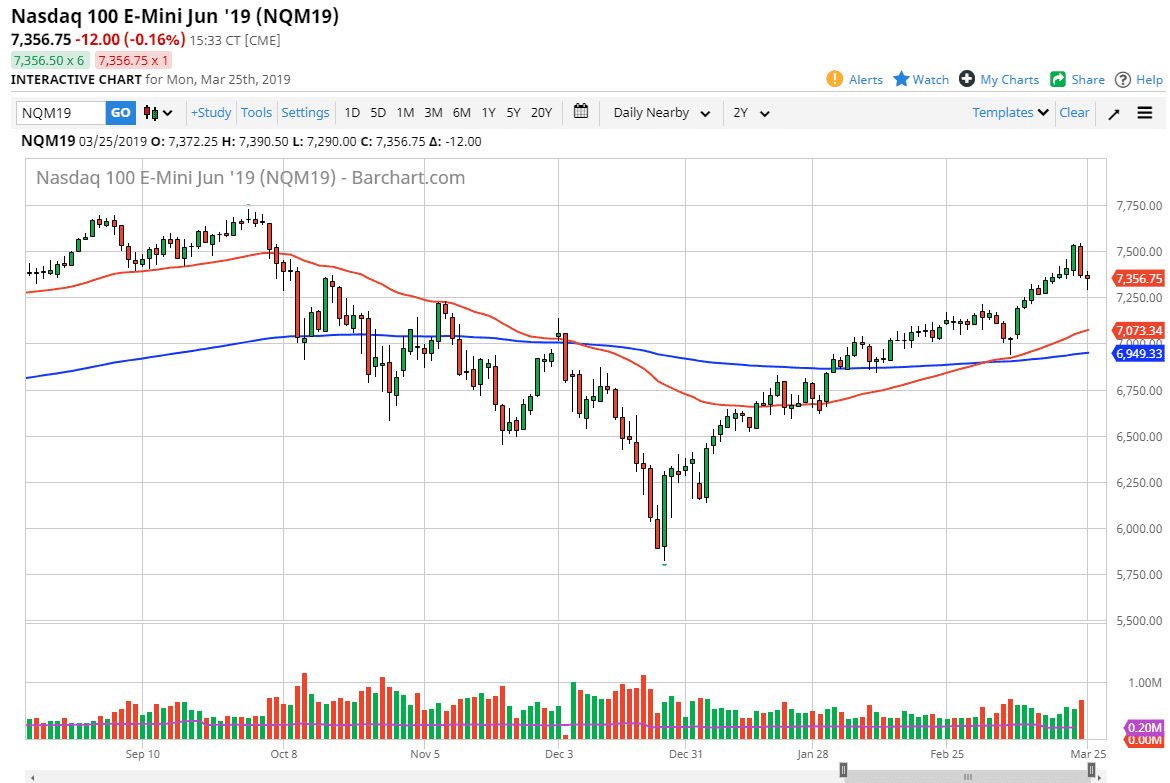
The NASDAQ 100 initially fell as well, reaching down towards the 7300 level before turning around to form a hammer. The hammer of course is a very bullish sign, so if we can break above the top of the candle stick, the market will probably go looking towards the 7500 level above. If we can clear that level, then we can go much higher. To the downside, if we clear the 7250 level it’s likely that we will go looking towards the 50 day EMA underneath. At this point, the market is very much in and uptrend and the NASDAQ 100 has lead the S&P 500 over the longer-term, so I think it continues to do so here. With this, I think that we are setting up for a nice buying opportunity if we can clear the top of the candle stick from Monday.


