S&P 500
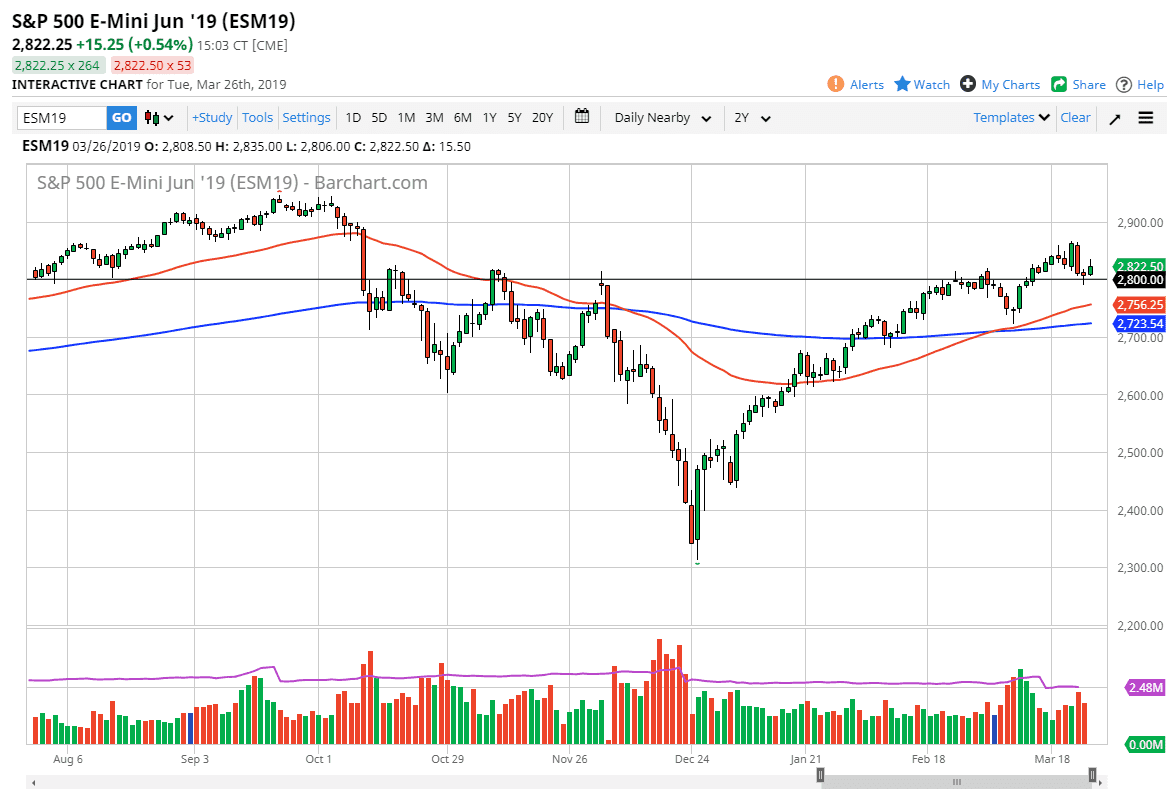
The S&P 500 rallied during the trading session on Tuesday but gave back quite a bit of the gains as we could not hang on to the bullish pressure all day. However, we have broken above the top of a hammer candle stick, which is a bullish sign. If that’s going to be the case, then it’s very likely that we could reach towards the top of the short term range, meaning that we could see a move to the 2860 level. It wasn’t exactly the most impressive candle, but the fact that we broke above the top of the previous hammer does suggest that there is a certain amount of momentum still there. The bottom of the hammer from Monday is massive support so if we were to break down below there then will go looking towards the 50 day EMA, pictured in red on the chart.
NASDAQ 100
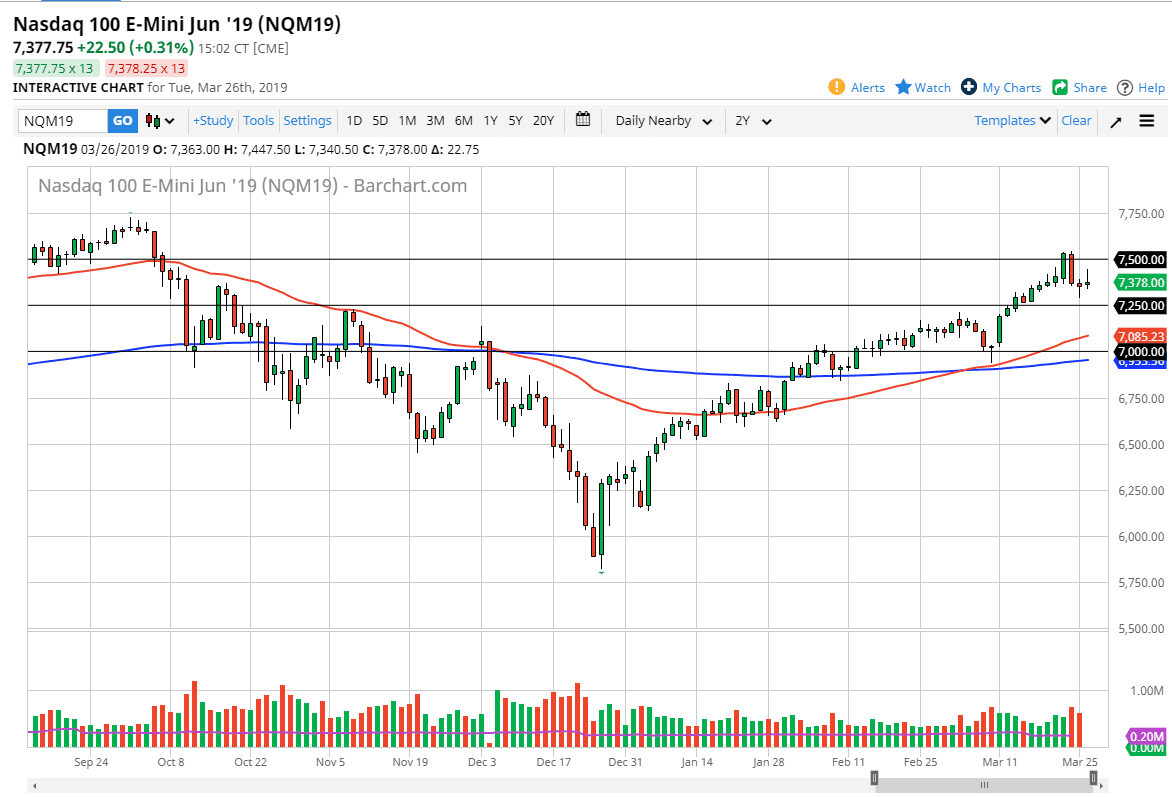
The NASDAQ 100 also tried to rally but got back quite a bit of the gains as we did end up forming a bit of a shooting star. The 7500 level above is massive resistance, and the 7250 level underneath is massive support. That being the case, it’s very unlikely that we are going to get a major move in one direction or the other, as these conflicting candlesticks normally mean consolidation and a lot of confusion. If that’s going to be the case that it makes sense that perhaps short term back and forth trading is the best way to approach this market. The trend is still very much to the upside, but it hasn’t exactly looked great over the last two sessions. Nonetheless, the path of least resistance is probably still going to be higher.


