Start Trading Now Get Started
Table of Contents
Affiliate Disclosure
Affiliate Disclosure DailyForex.com adheres to strict guidelines to preserve editorial integrity to help you make decisions with confidence. Some of the reviews and content we feature on this site are supported by affiliate partnerships from which this website may receive money. This may impact how, where and which companies / services we review and write about. Our team of experts work to continually re-evaluate the reviews and information we provide on all the top Forex / CFD brokerages featured here. Our research focuses heavily on the broker’s custody of client deposits and the breadth of its client offering. Safety is evaluated by quality and length of the broker's track record, plus the scope of regulatory standing. Major factors in determining the quality of a broker’s offer include the cost of trading, the range of instruments available to trade, and general ease of use regarding execution and market information.
toc-menu-hamburger.png
table of content

Table of Contents

toggle-toc.png

S&P 500 and Nasdaq Forecast - 28 March 2019

By Christopher Lewis
Christopher Lewis has been trading Forex and has over 20 years experience in financial markets. Chris has been a regular contributor to Daily Forex since the early days of the site. He writes about Forex for several online publications, including FX Empire, Investing.com, and his own site, aptly named The Trader Guy. Chris favours technical analysis methods to identify his trades and likes to trade equity indices and commodities as well as Forex. He favours a longer-term trading style, and his trades often last for days or weeks.

S&P 500

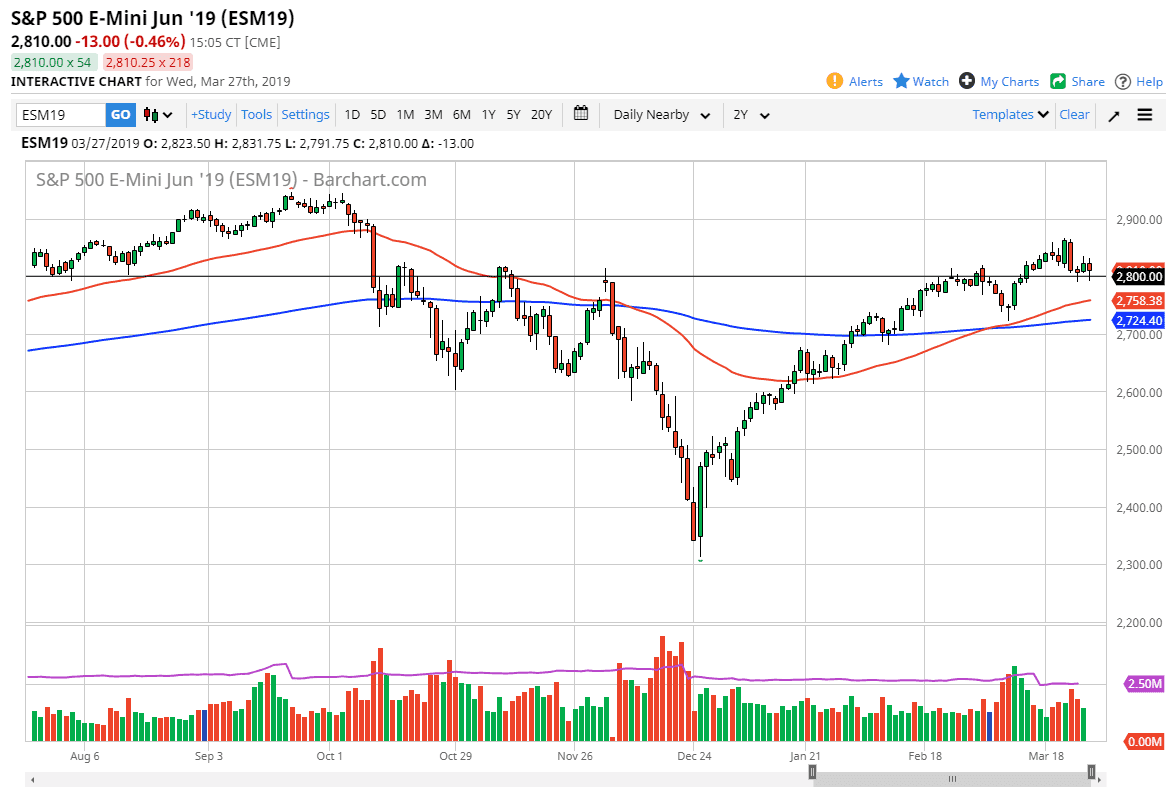
The S&P 500 initially pulled back during trading on Wednesday but found enough support yet again at the 2800 level to turn around and show signs of bullishness. We ended up forming a hammer for the trading session, which of course is a very strong sign indeed.

That being the case, it appears that the 2790 level continues to offer major support. At this point, I think that short-term pulling back offers short-term buying opportunities. If we break down below the 2790 handle, then it’s likely that we probably go looking towards the 50 day EMA which is pictured in red on the chart. To the upside, we could go looking towards the highs again, which is closer to the 2860 handle. One thing is for sure, it’s going to continue to be very volatile in this market but seems to be somewhat resilient.

SP 500

NASDAQ 100

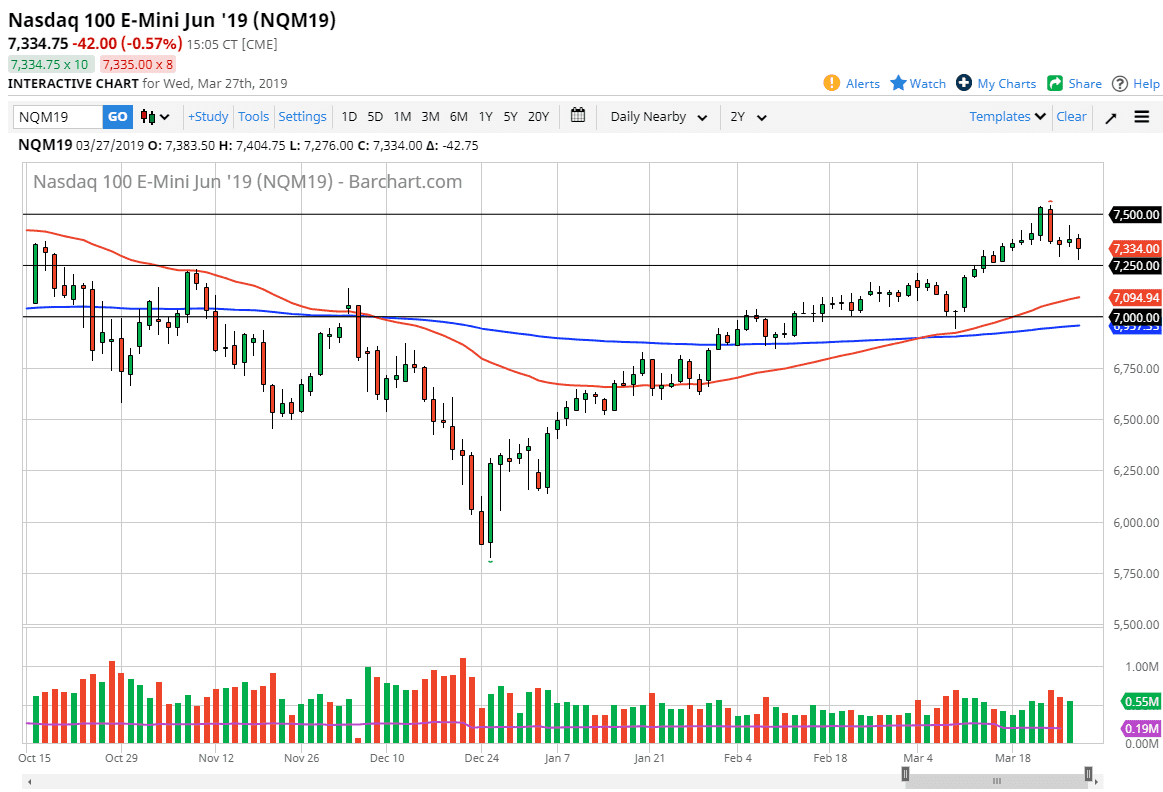
The NASDAQ 100 initially fell during the trading session as well but has bounced from just above the 7250 level yet again. We have turned around of form a hammer which flies in the face of the shooting star from the previous session. At this point, I’m using 7250 as the “floor” of the market, and short-term pullbacks should be buying opportunities. I have no interest in trying to short this market, and I think that as long as we can stay above that level it’s probably easier to buy this market than it is to sell it. That being said, keep an eye out for a move below the 7250 level because it could open up a move down to the 50 day EMA. If we do continue to find buyers I anticipate that eventually we will go looking towards the 7500 level again.

Nasdaq

Christopher Lewis
About Christopher Lewis
Christopher Lewis has been trading Forex and has over 20 years experience in financial markets. Chris has been a regular contributor to Daily Forex since the early days of the site. He writes about Forex for several online publications, including FX Empire, Investing.com, and his own site, aptly named The Trader Guy. Chris favours technical analysis methods to identify his trades and likes to trade equity indices and commodities as well as Forex. He favours a longer-term trading style, and his trades often last for days or weeks.
 

Most Visited Forex Broker Reviews