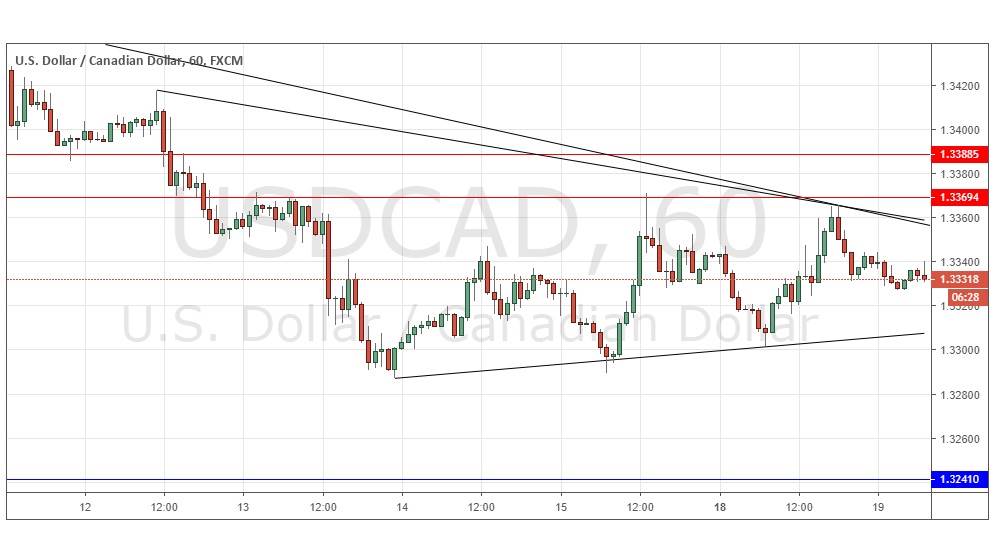
Yesterday’s signals were not triggered, as the bearish price action took place between 1.3352 and 1.3369.
Today’s USD/CAD Signals
Risk 0.75% per trade.
Trades must be taken before 5pm New York time today only.
Long Trade
Long entry after the next bullish price action rejection following the next touch of 1.3241.
Put the stop loss 1 pip below the local swing low.
Move the stop loss to break even once the trade is 20 pips in profit.
Remove 50% of the position as profit when the trade is 20 pips in profit and leave the remainder of the position to run.
Short Trades
Short entry after the next bearish price action rejection following the next touch of 1.3369 or 1.3389.
Put the stop loss 1 pip above the local swing high.
Move the stop loss to break even once the trade is 20 pips in profit.
Remove 50% of the position as profit when the trade is 20 pips in profit and leave the remainder of the position to run.
The best method to identify a classic “price action reversal” is for an hourly candle to close, such as a pin bar, a doji, an outside or even just an engulfing candle with a higher close. You can exploit these levels or zones by watching the price action that occurs at the given levels.
USD/CAD Analysis
I wrote yesterday that the current price action was bearish and there was no support before 1.3241. However, there are swing lows close to 1.3285 to I wanted to see that level broken down on above-average volatility before turning bearish, just as I did last Thursday, until the 1.3241 level was reached.
That level broke down, so my call was enough to stay out of trouble. The price made another bearish move from the area of resistance highlighted but has made another higher low and the price chart below shows the price is in a consolidating triangle. I still think it is likely to break lower rather than higher but that probably will not happen until the FOMC release later in the week. There is nothing of high importance due today concerning the CAD or the USD.

