WTI Crude Oil
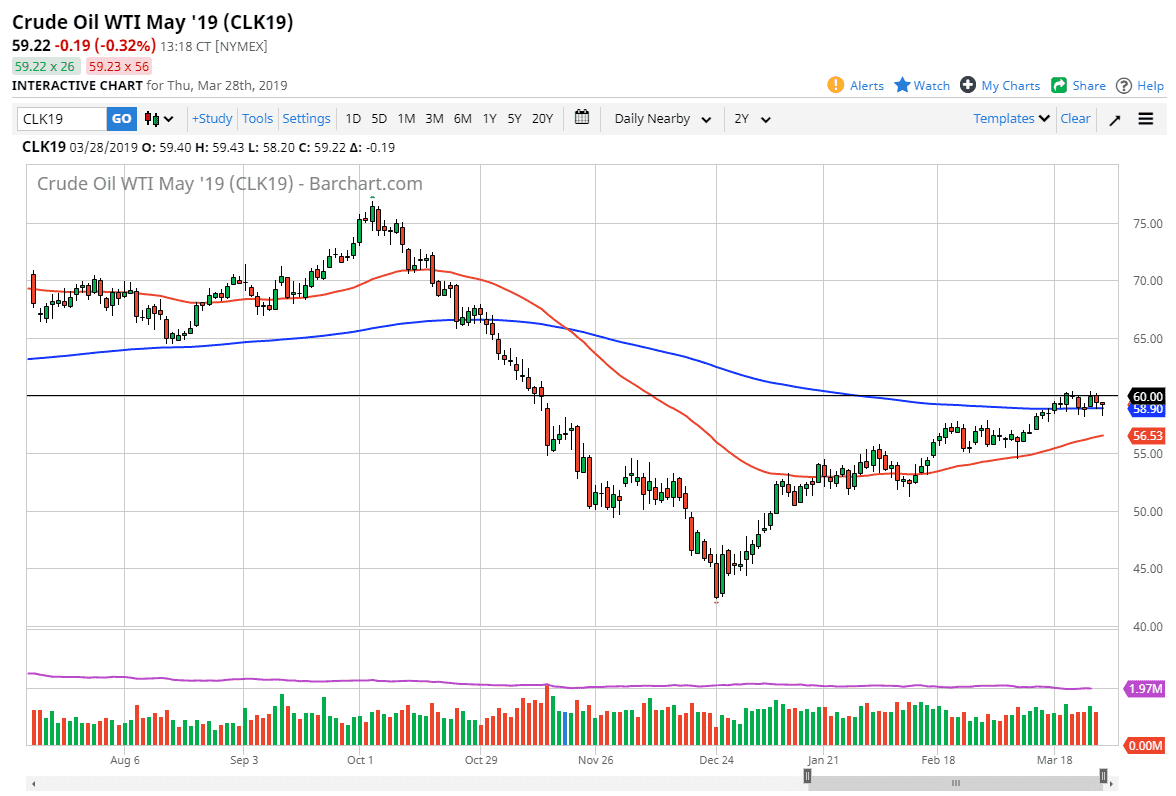
The WTI Crude Oil market has pulled back rather significantly during trading on Thursday, only to turn around and form a nice-looking hammer for the daily chart. At this point, it’s likely that the buyers will continue to jump into this market as the 200 day EMA has been so reliable over the last couple of weeks. Looking at the chart, it looks to me as if we are trying to build up enough momentum to finally break above the $60 handle drastically, sending this market to much higher levels. However, it seems as if it’s going to take a lot of momentum building to make that move. In the short term, buying dips continues to work and therefore we are better off looking at the short-term charts to place our trades to the upside. However, if we break down below the lows of the Monday candle, then we may pull back to the 50 day EMA pictured in red.
Natural Gas
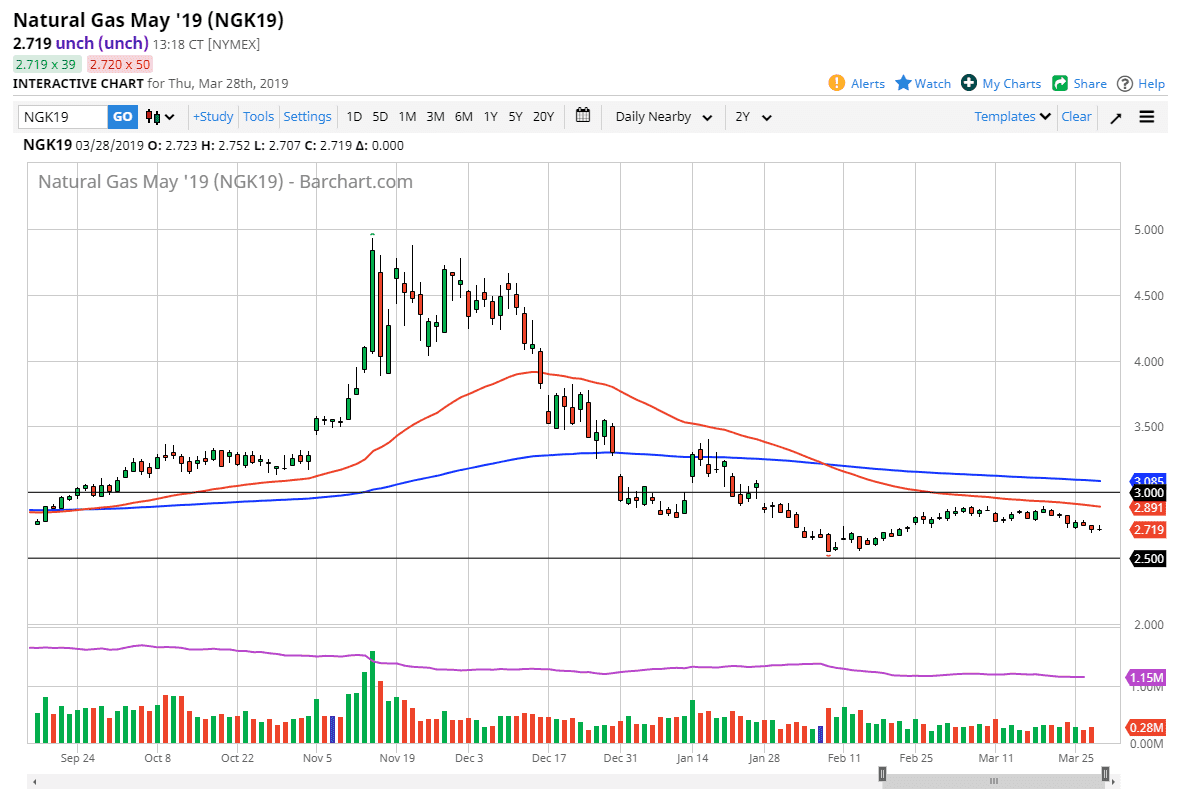
This is a market that is essentially dead money right now because we are in the middle of a larger trading range. With that in mind, it makes sense that we continue to struggle for any serious form of clarity. It’s very likely that we continue to see support and resistance at the same areas, with resistance starting at the $2.90 level and extending to the $3.00 level, while the support starts at $2.60 down to the $2.50 level. As we are in the middle of this range, it makes no sense in putting too much money to work here. Once we get to the outer part of the range though, then it’s time to start trading back and forth again.


