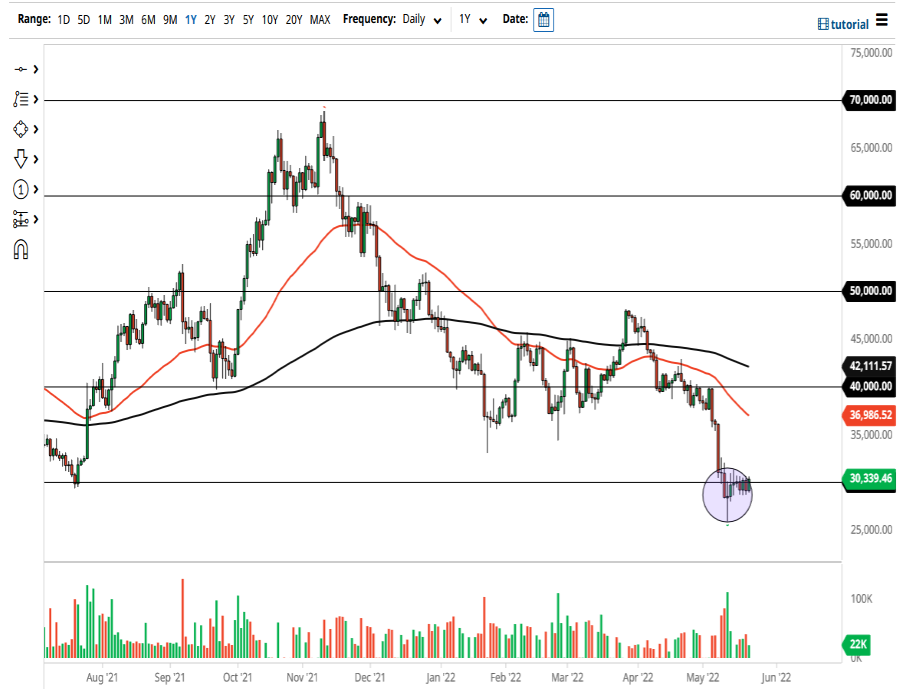
Bitcoin markets rallied a bit during trading again on Tuesday, reaching towards the top of the Monday candle stick which of course was a bit of exhaustion. Now that we have broken above by just a bit, it shows just how much bullish pressure there is underneath. In fact, this is another hint as to where we are going to go as far as the longer-term trade is concerned.
The 200 day EMA sits just below current pricing, and it is looking rather supportive. In fact, it’s even starting to turn higher given enough time. We have an uptrend line that suggest we could be forming an ascending triangle, and then finally we have the 50 day EMA underneath turning higher as well. These are all reasons to think that bitcoin is going to continue to go higher over the longer-term but obviously we have some momentum building to go higher from here as we have seen such an explosive move recently.
Beyond that, the volume spike that we had seen during the initial push higher does suggest that there are a lot of buyers underneath. Dips in price will be thought of as value at this point, at least until we would break down below the 50 day EMA which has been reasonably reliable in this market for some time. To the upside though, there are areas of resistance to be cautious about.
The areas of resistance that I see on the chart currently are at the $5500 level and the $6000 level. The $6000 level above had been massive support in the past so it would make sense if it was difficult to break above there. I think in the short term we are simply pulling back occasionally in order to build up the necessary momentum to attempt that break out.

