S&P 500
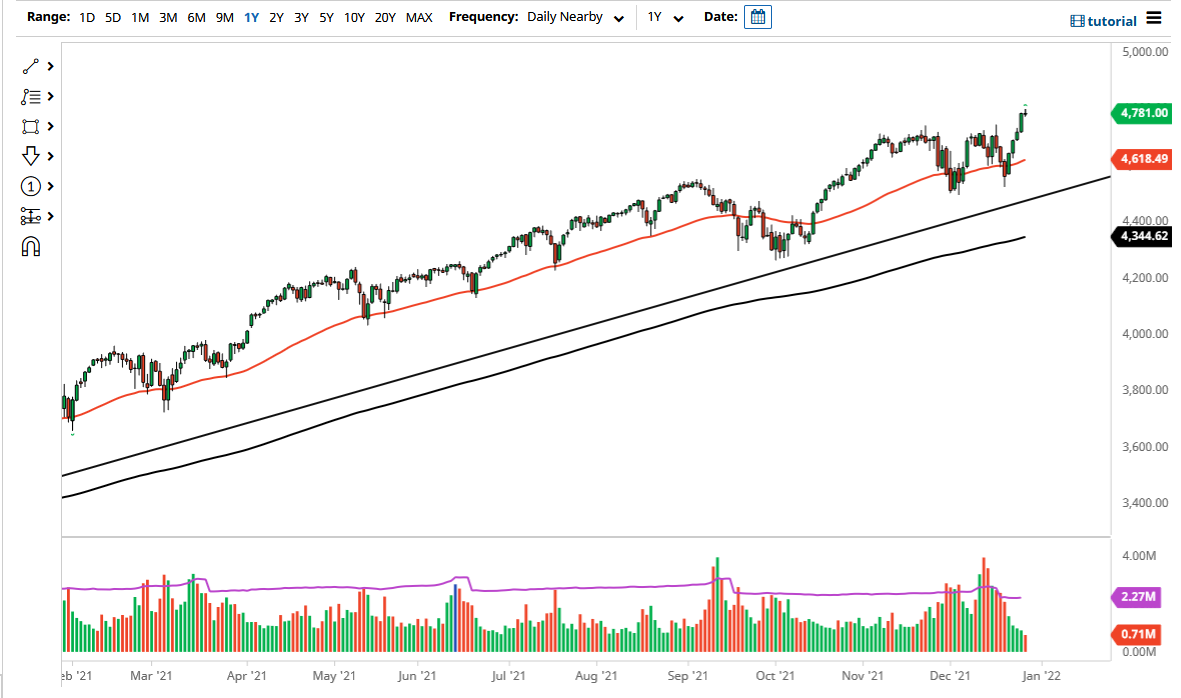
The S&P 500 initially fell during the trading session on Monday, as we started to reach towards the 2900 level. That’s an area that of course is a large come around, psychologically significant figure, and the beginning of what is probably going to be major resistance. We pulled back to find buyers and did in fact reach towards the 2900 level to form a bit of a hammer like candle. If we break down below the back that hammer and of course would be a negative sign.
Looking at this chart, it’s easy to see that there is a lot of consolidation between the 2900 and the 2940 level above, as drawn by the rectangle. In general, that is a lot of resistance just above so I think we are going to struggle at this point. That being said, I don’t have any interest in trying to short this market. I think we need a pullback that we can buy based upon value, which is something we should get rather soon.
NASDAQ 100
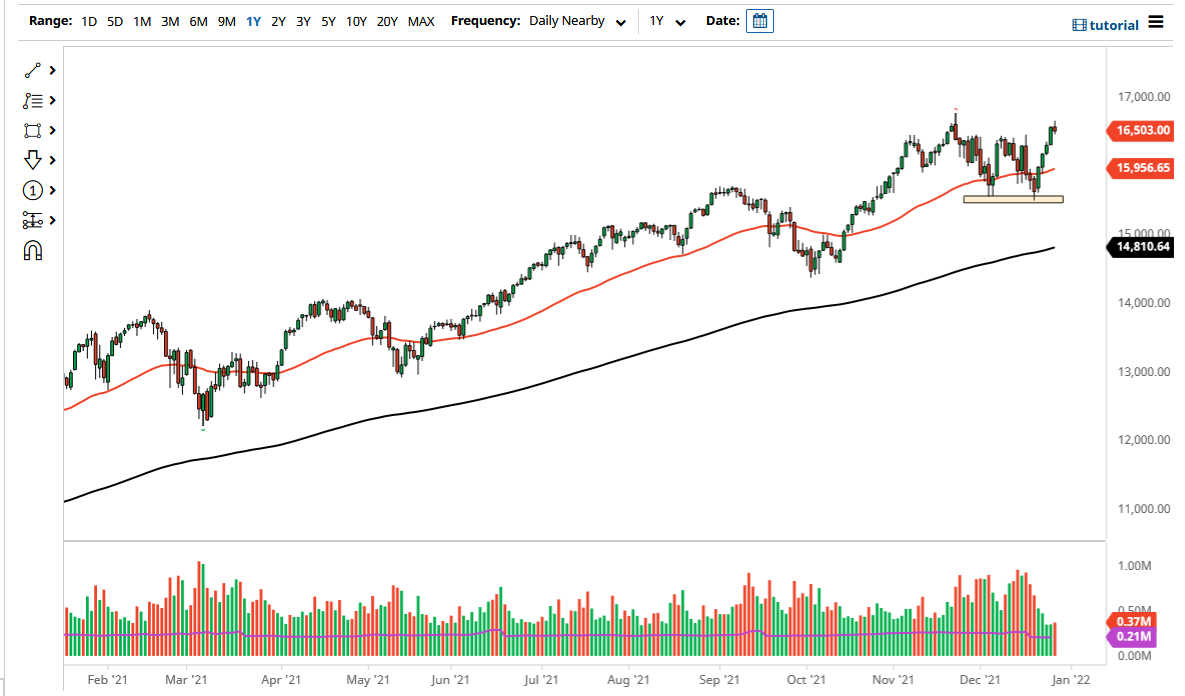
The NASDAQ 100 also initially pulled back but then turned around to show signs of strength and reach towards the 7625 handle. The NASDAQ 100 will probably lead the way for other indices that we follow, as the market features the likes of Facebook, Google, etc. Those are the markets that are trying to catch up in the stock market, so it’s very likely that if we do get some type of “melt up”, it will be led by the NASDAQ 100.
That being said, if we break down significantly here, that could be the canary in the coal mine so to speak. All things being equal, you need to pay attention to the NASDAQ 100 even if you are trading it. I do prefer buying pullbacks as I think the 7500 level will be massive support.


