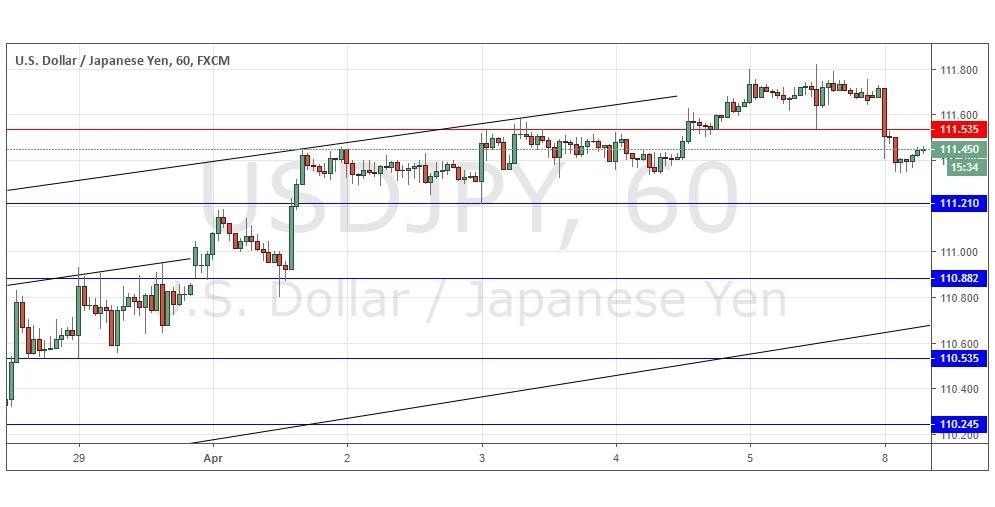
Last Thursday’s signals were not triggered, as there was no bearish price action at 111.63.
Today’s USD/JPY Signals
Risk 0.75%.
Trades must be entered between 8am New York time Monday and 5pm Tokyo time Tuesday.
Short Trades
- Short entry following a bearish price action reversal on the H1 time frame immediately upon the next touch of 111.54 or 112.10.
- Place the stop loss 1 pip above the local swing high.
- Move the stop loss to break even once the trade is 20 pips in profit.
- Take off 50% of the position as profit when the trade is 20 pips in profit and leave the remainder of the position to run.
Long Trades
- Long entry following a bullish price action reversal on the H1 time frame immediately upon the next touch of 111.21, 110.88, or 110.54.
- Place the stop loss 1 pip below the local swing low.
- Move the stop loss to break even once the trade is 20 pips in profit.
- Take off 50% of the position as profit when the trade is 20 pips in profit and leave the remainder of the position to run.
The best method to identify a classic “price action reversal” is for an hourly candle to close, such as a pin bar, a doji, an outside or even just an engulfing candle with a higher close. You can exploit these levels or zones by watching the price action that occurs at the given levels.
USD/JPY Analysis
I wrote last Thursday that I was still mildly bullish, looking for a bullish sign at a break above 111.63 or a very bullish sign from a break above 112.10. I was right insofar as the price continued to advance and broke above 111.63 but has fallen from the highs around 111.80 which are near long-term highs. The fall was relatively sharp and there is new lower resistance. However, the picture still looks basically bullish as the price trades within a medium-term bullish price channel which is shown in the chart below. I would take a bullish bias if we get a retrace to 111.21 and a strong bullish bounce there.
There is nothing of high importance due today concerning either the JPY or the USD.

