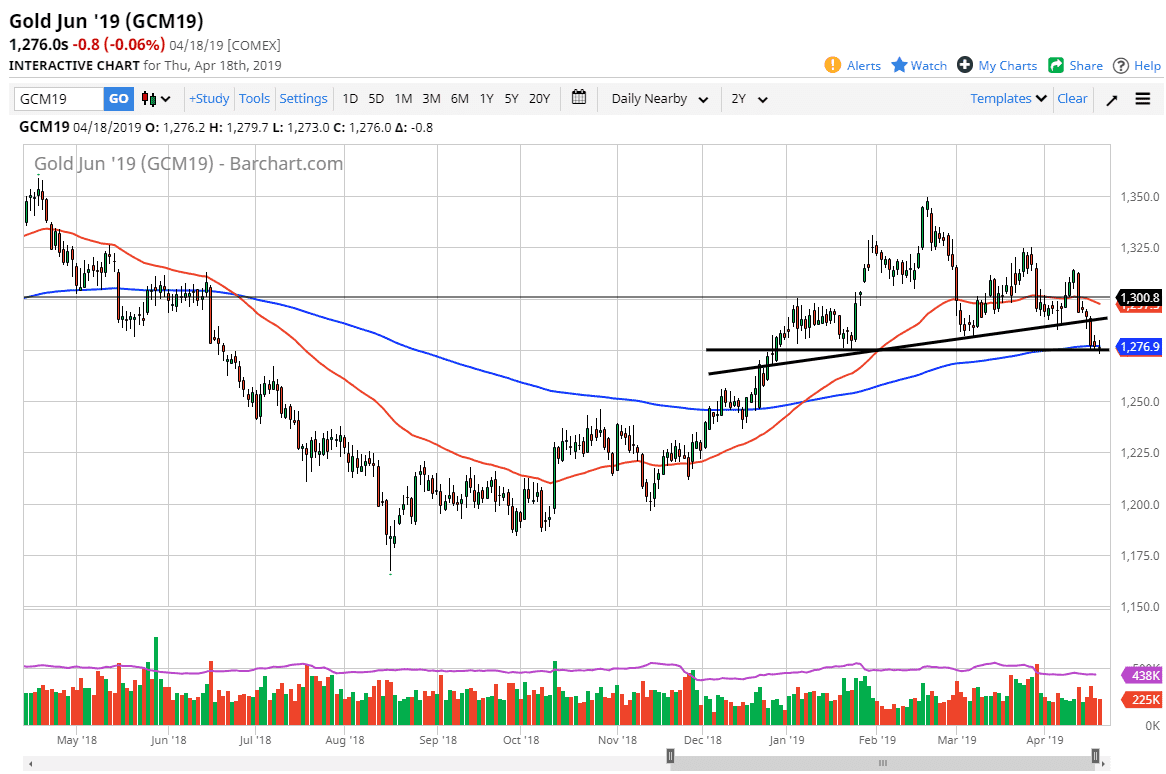
Gold markets didn't trade on Friday as it was Good Friday, but when we look at the daily chart it’s easy to see that the $1275 level is very important. I have a couple of lines drawn on the chart, one of which is a trend line and the other is a support line. We have a couple of scenarios that stick out to me right now, both of which are very bearish.
If we break down below the lows of the Thursday candle stick, then I think the market unwinds towards the $1250 level, perhaps even the $1225 level after that. That would of course signify a breakdown of horizontal support, but as you can see I also have an uptrend line, which could signify the head and shoulders pattern drawn out. If that’s the case then we have already broken the neckline but we still have plenty of room to go. Either way, both of those realities tell me the same thing: that Gold is falling. One of the things that is supporting her right now is also the 200 day EMA, so be advised that we could get a bit of choppiness in the short term.
This isn’t to say that we can’t rally, of course we can. However I think that the top of the candle stick from Tuesday could also offer resistance as it is not only a break down through a hammer, but it is also where the uptrend line, or the neck line, is showing itself. At this point, I don’t have any interest in buying gold until we break above the Tuesday highs, and even then I would have to reevaluate the situation. In short, I think that a break down below the candle stick on Thursday is a selling opportunity, just as a rally should be unless we break above Tuesday’s high.

