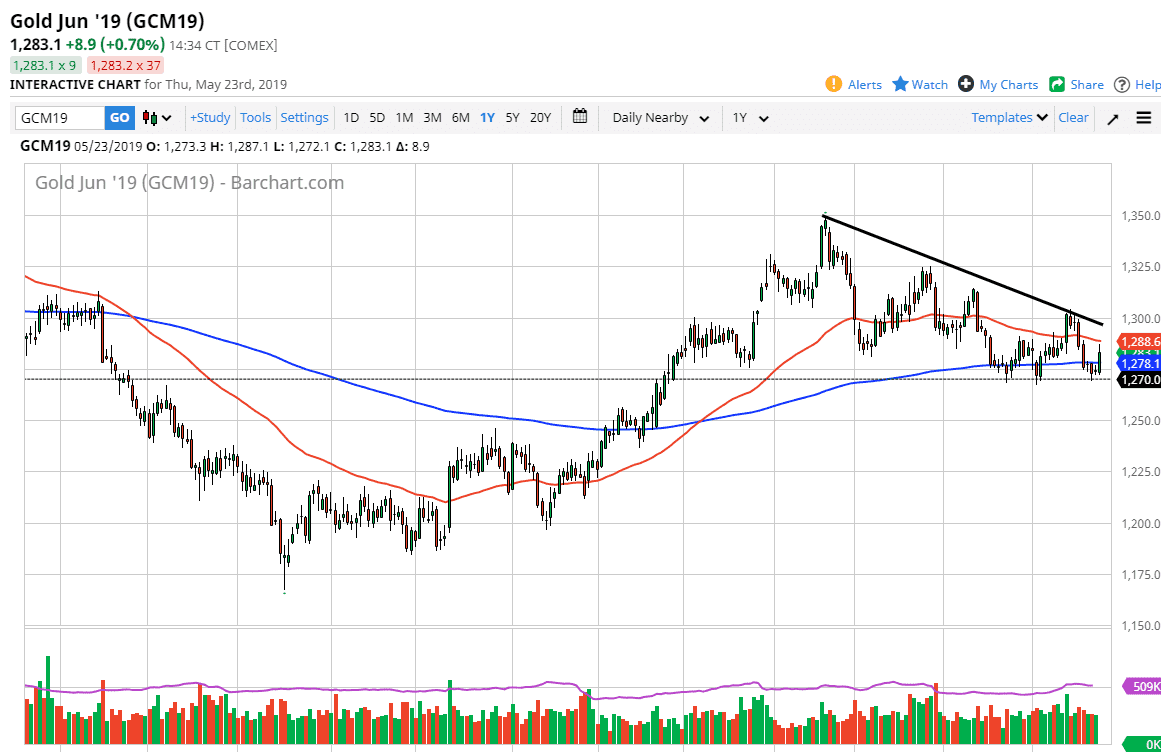
Gold markets rallied rather significantly during the trading session on Thursday, breaking above the 200 day EMA, reaching towards the $1285 level before finding plenty of selling. At this point, the exhaustion on short-term charts does in fact suggest that we could drop from here, and if that’s the case we may revisit the $1270 level.
Gold market of course was reacting to the insane moves in the S&P 500 and probably more specifically the oil market, as fear gripped traders around the world due to the trade war between America and China. That being said, there are plenty of reasons to think that sellers are waiting above, not only due to the shorter-term charts, but the fact that the 50 day EMA did in fact hold as resistance. Beyond that, there is a downtrend line that is closer to the $1300 level, and that of course is a major barrier due to not only the downtrend line and the large, round, psychologically significant level.
To the downside, I believe that the $1270 level is the “floor” in the market, so if we rollover and break down through there, this is a market that unwinds very rapidly. Looking at this chart, is very likely that we will continue to rollover, especially if the US dollar starts to strengthen again. Looking at this chart, it’s very likely that we will continue to fade any signs of strength. Although the day was rather strong, the reality is that it’s but a blip on the longer-term charts. To the downside, if we break down through the $1270 level, we will probably go to the $1250 level next as it is a major level on longer-term charts.

