S&P 500
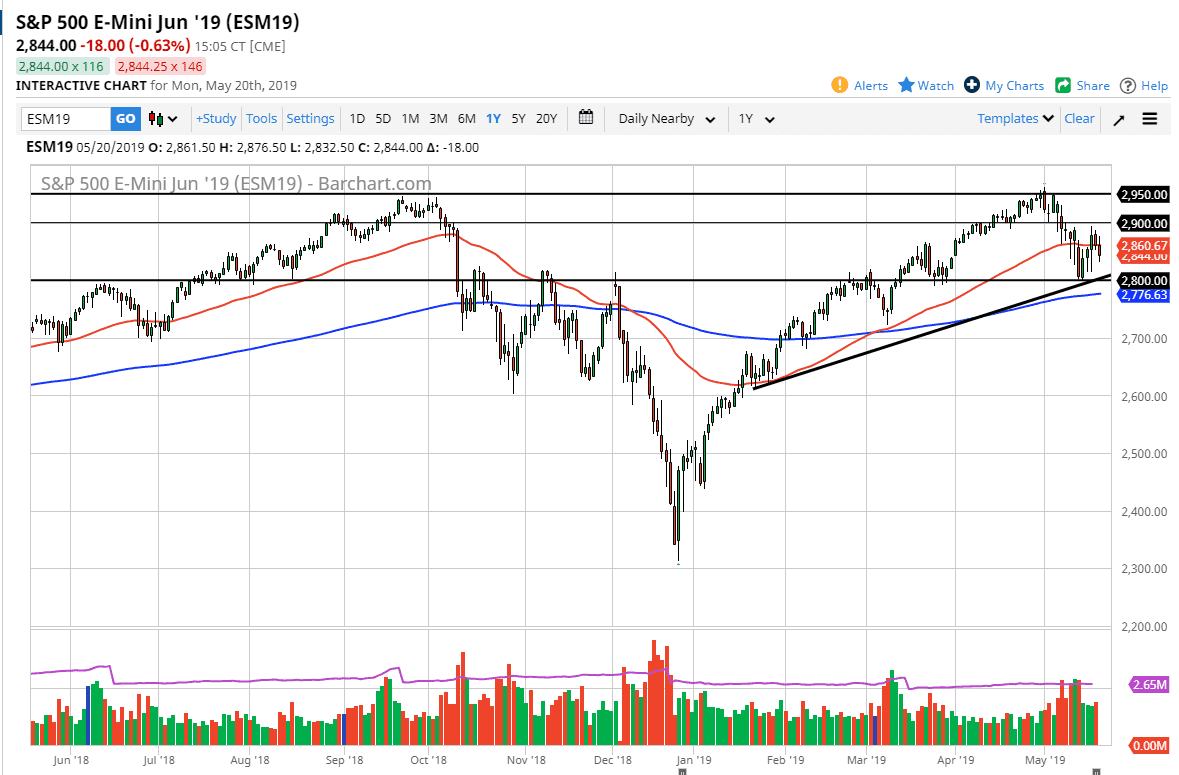
The S&P 500 initially tried to break down on Monday, turned around to rally again, but then rolled over at the 50 day EMA. By doing so, the market looks very likely to continue to struggle in general, and at this point in time the market looks as if it could very well try to go down towards the trend line. The 2900 level above is massive resistance, so I think at this point what we are probably going to see is more in fact a bounce around type of situation. Looking at this chart, I believe that we will continue to see a lot of pressure in both directions, so you can’t necessarily look for a bigger move. You need to be able to trade back and forth on short-term charts, because at this point we are starting to trade on a motion more than anything else.
NASDAQ 100
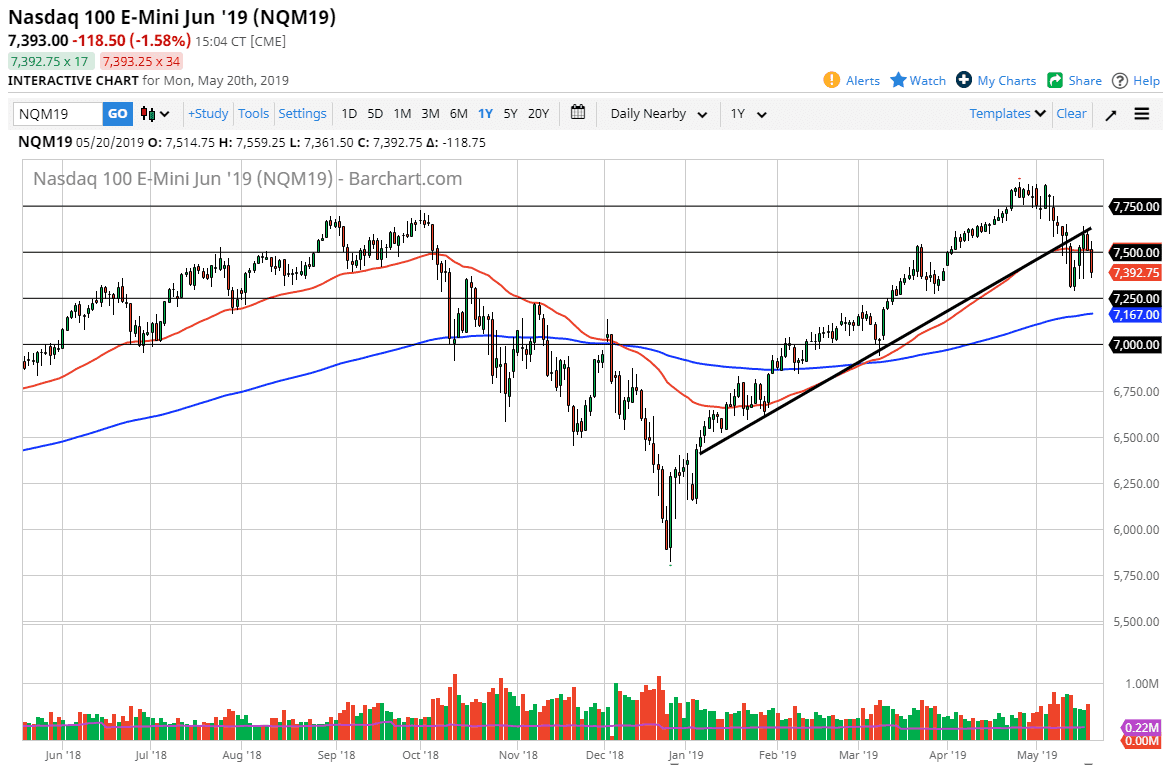
The NASDAQ 100 is a little bit of a different story though, because we have broken down through a major trendline, and although we haven’t made a fresh, new low, I believe is probably only a matter time before that happens and it will be due to some type of Chinese announcement during Asian trading. The Chinese are now threatening to cut off of rare earth minerals, in reaction to the multiple tit for tat type of announcements that the Americans and the Chinese are throwing at each other.
The 7250 level is support, just as the 200 day EMA below there is. Given enough time, I think we will very likely try to test those areas, and I do recognize that you could even make an argument for a little bit of a bearish flag now.


