S&P 500
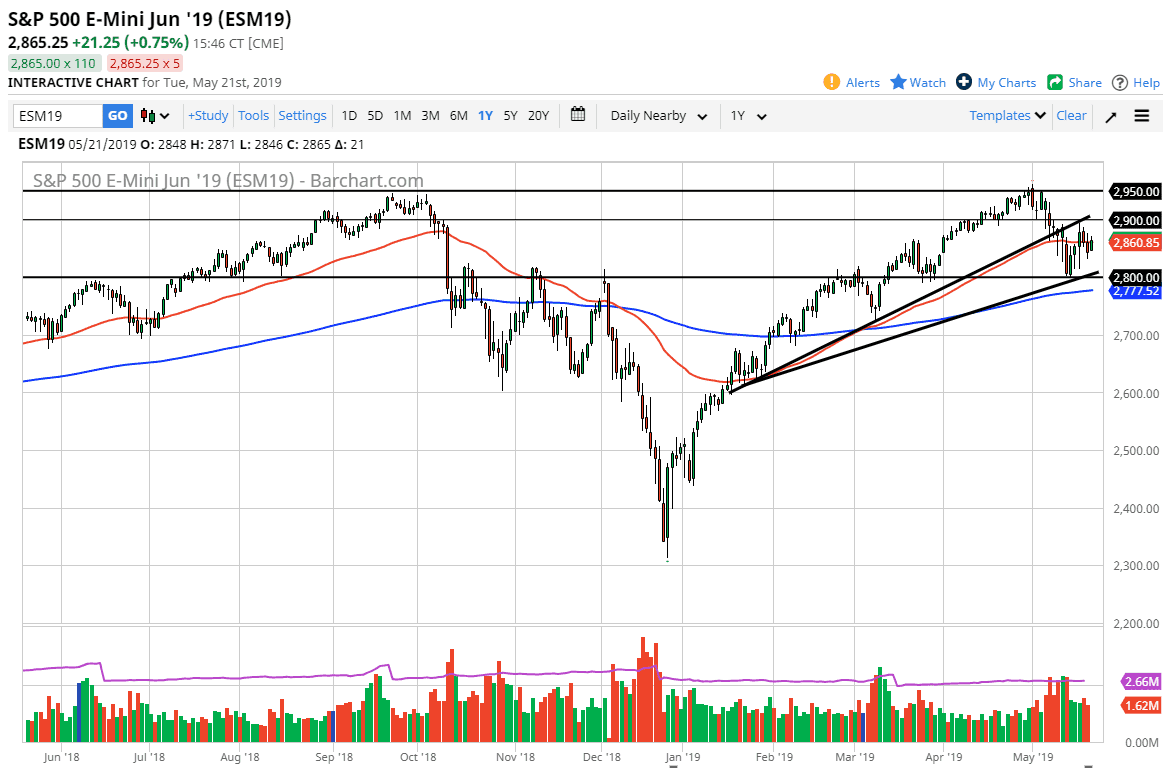
The S&P 500 rallied a bit during the trading session on Tuesday, as we continue to dance around the 50 day EMA. At this point in time it’s looking very likely to be a 100 point range that we are trading in, with the 2900 level above being resistance, just as the 2800 level underneath is massive support. We have already broken one uptrend line, so the question is now whether or not we break down through the lower one? This is a bit of a perfect situation for a range bound market, which makes a lot of sense considering just how much there is going on around the world right now.
The best part about this situation is that we have such a clearly defined range, so of course we need to pay attention to that. If we break through one of the two levels mentioned previously, then we have a clear direction in which we can trade. You simply follow where the market goes.
NASDAQ 100
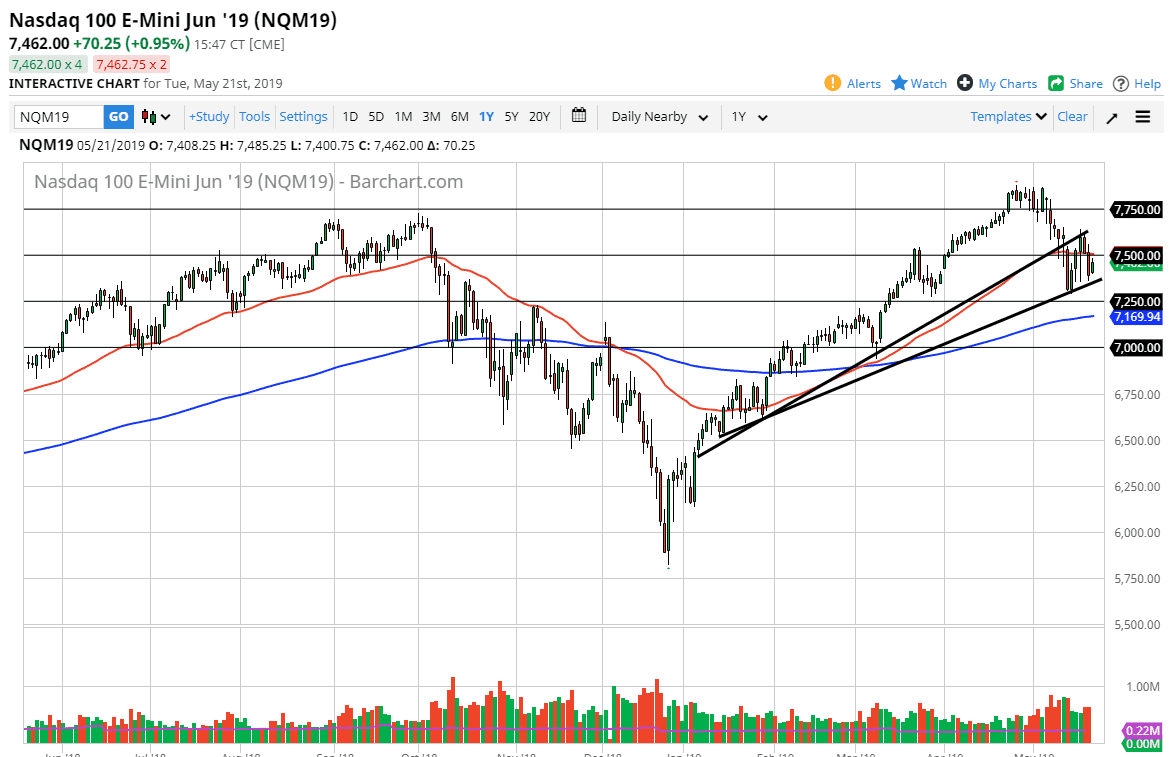
The NASDAQ 100 has also been between a couple of uptrend lines, and now it looks as if the 7500 is a bit of an equilibrium, and if we break down through the uptrend line underneath, then we could go down to the 7250 level. On the other hand, if we break above the 7600 level, then the market would probably go to the 7750 handle. I believe that this market will continue to be very volatile, and keep in mind that the NASDAQ 100 is so highly levered to the technology sector, and of course everything that’s going on between the United States and China it’s likely that we will continue to be volatile.


