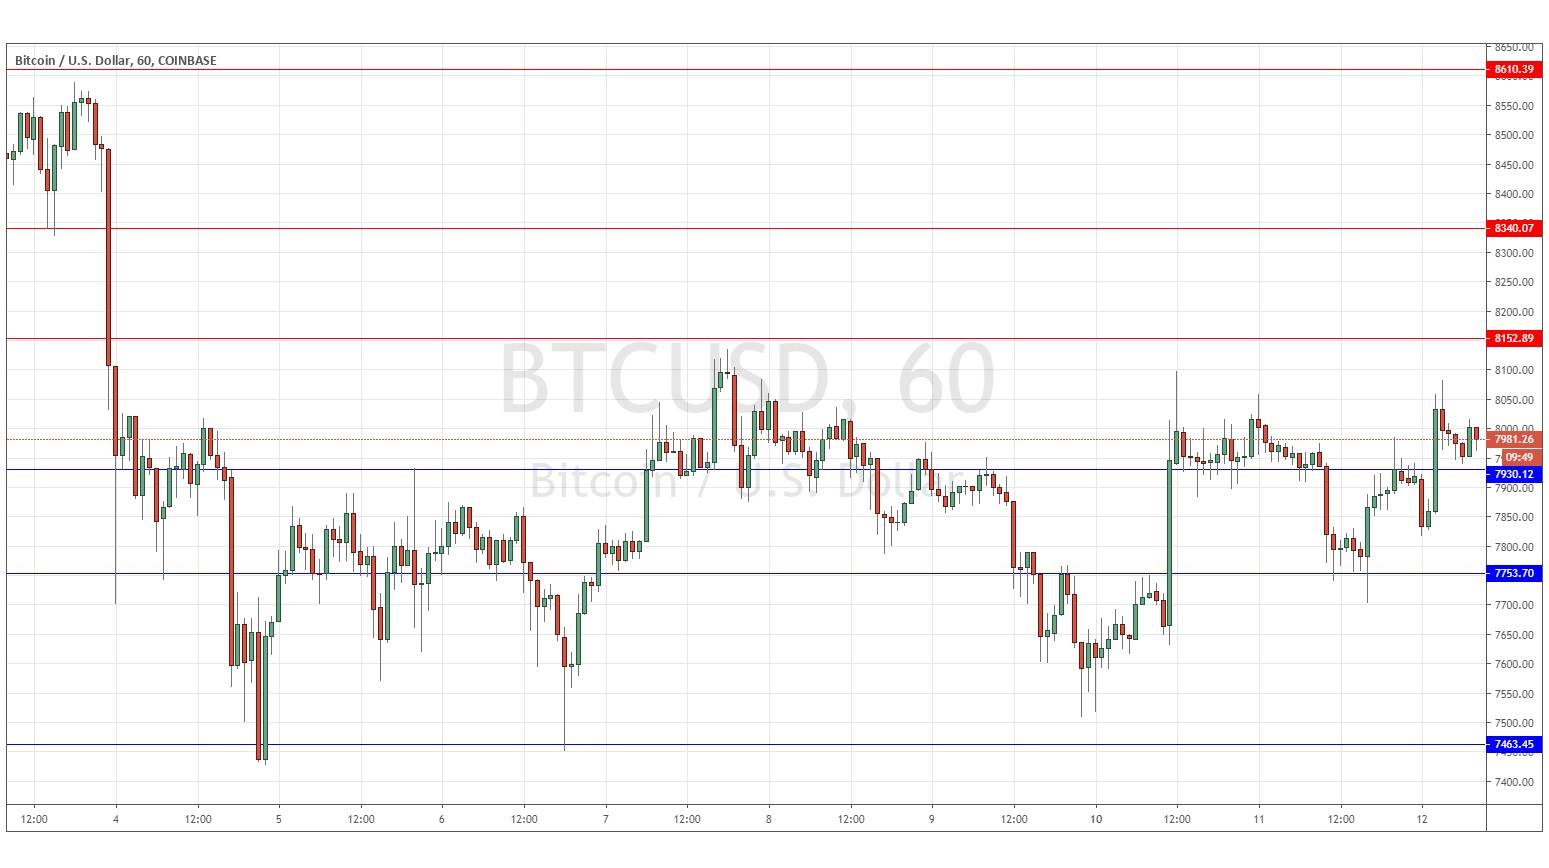
Bitcoin: Bottoming from $7,463
Yesterday’s signals produced a losing long trade from the bullish inside candlestick following the initial rejection of the support level at $7,793.
Today’s BTC/USD Signals
Risk 0.75% per trade.
Trades must be entered prior to 5pm Tokyo time Thursday.
Long Trades
Long entry at a bullish price action reversal on the H1 time frame following the next touch of or $7,754 or $7,463.
Put the stop loss 1 pip below the local swing low.
Move the stop loss to break even once the trade is $50 in profit by price.
Remove 50% of the position as profit when the trade is $50 in profit by price and leave the remainder of the position to run.
Short Trades
Short entry after a bearish price action reversal on the H1 time frame following the next touch of $8,153 or $8,340.
Put the stop loss 1 pip above the local swing high.
Move the stop loss to break even once the trade is $50 in profit by price.
Remove 50% of the position as profit when the trade is $50 in profit by price and leave the remainder of the position to run.
The best method to identify a classic “price action reversal” is for an hourly candle to close, such as a pin bar, a doji, an outside or even just an engulfing candle with a higher close. You can exploit these levels or zones by watching the price action that occurs at the given levels.
BTC/USD Analysis
I wrote yesterday that there had been a strong upwards push flipping the level at $7,793 from resistance to new higher probable support, and although the price was a little below where the long trade entry would have been made, there was another higher support level we could draw in the price chart at $7,923. These are bullish signs, yet I saw the bearish case and was only weakly bullish.
This was a reasonably good call as the price has dipped over the past 24 hours but ended up back where it was this time yesterday. The support level nearby had to be readjusted to $7,753 (confluent with the psychological level at $7,750) and there is also higher support at $7,930 but I do not want to use that second level yet as it has already almost been reached.
The big picture is a consolidation pattern between $7,463 and $8,143. If the price can get established above $8,153 and begin to use it as higher support, I would take a bullish bias. Regarding the USD, there will be a release of CPI (inflation) data at 1:30pm London time.
