The difference between success and failure in Forex trading is very likely to depend upon which currency pairs you choose to trade each week, and not on the exact trading methods you might use to determine trade entries and exits. Each week I am going to analyze fundamentals, sentiment and technical positions in order to determine which currency pairs are most likely to produce the easiest and most profitable trading opportunities over the next week. In some cases it will be trading the trend. In other cases it will be trading support and resistance levels during more ranging markets.
Big Picture 16th June 2019
In my previous piece two weeks ago, I forecasted that the best trades would be short USD/JPY and short WTI Crude Oil. That week, the USD/JPY currency pair fell by 0.11% and WTI Crude Oil rose by 1.37% giving an averaged loss of 0.63%.
Last week’s Forex market again saw the strongest rise in the relative value of the U.S. Dollar, and the strongest fall in the relative value of the New Zealand Dollar.
Last week’s market was mixed and confused, as although the U.S. / Mexico dispute was resolved and stock markets broadly rose, commodity currencies were hit quite hard.
The Forex market was more active last week, with the best performing currencies relatively being the safe havens of the U.S. Dollar, Japanese Yen, and the Swiss Franc.
This week has a busier news agenda than last week, with central bank input due for the U.S. Dollar and the British Pound.
Fundamental Analysis & Market Sentiment
Fundamental analysis has turned more bearish on the U.S. Dollar following the Federal Reserve’s more dovish approach to monetary policy and growth and weaker than expected inflation data. However, the economy is still growing quite strongly. Although the stock market was been hit by the trade war with China it has partially recovered from this.
Market sentiment is a little mixed, as although the safe-haven assets (such as the U.S. Dollar and Gold) bid while the weaker currencies are the commodity currencies, particularly the New Zealand Dollar. The long-term bullish trend in the U.S. Dollar seems to have reasserted itself, despite many analysts seeing it as preparing to reverse.
Technical Analysis
U.S. Dollar Index
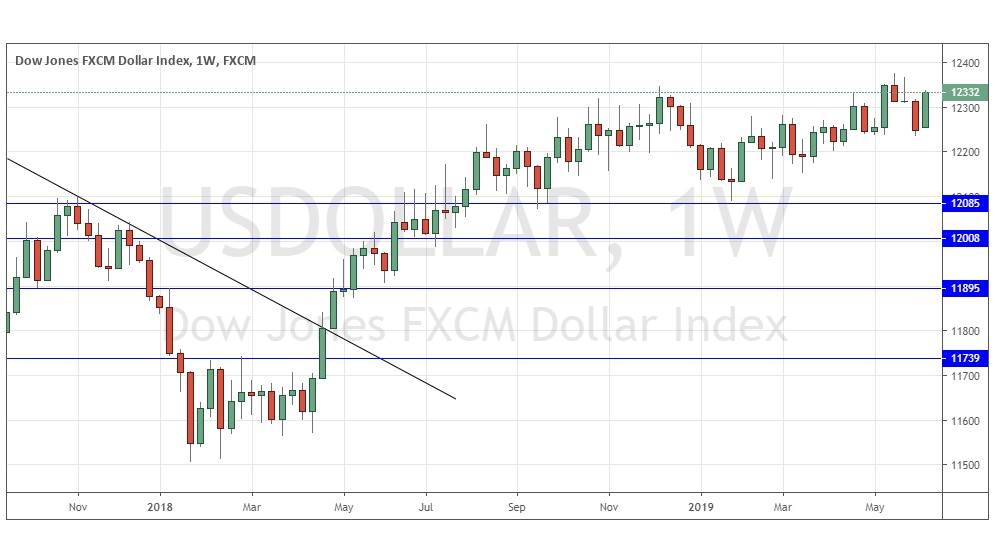
The weekly price chart below shows that last week the USD Index rose strongly near to its 2-year high, printing a relatively large and strongly bullish candlestick which closed right on its high. The price is clearly up over 3 months and 6 months, indicating a bullish trend. It seems to be safer to be bullish on the USD right away, until there is a technical bullish turn.
NZD/USD
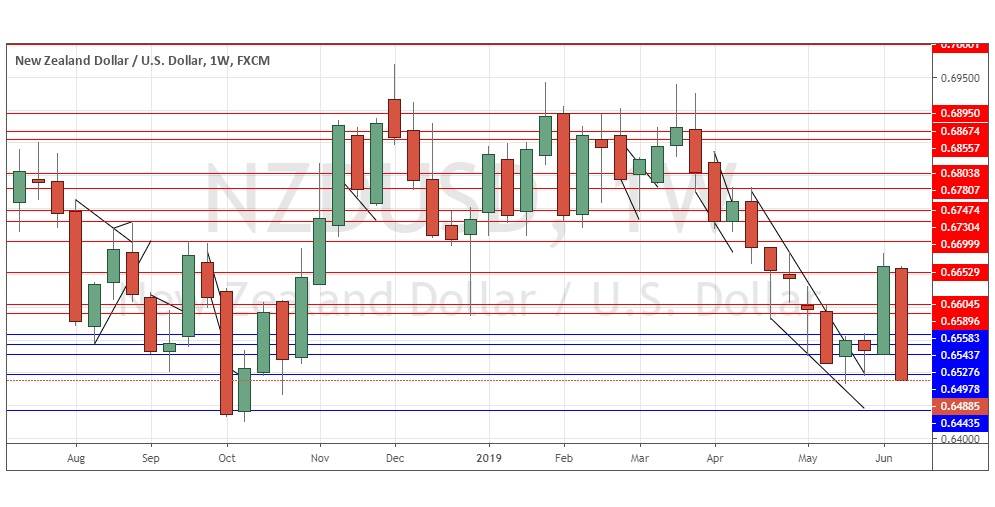
The weekly chart below shows last week saw this pair print a very large and strong bearish candlestick, closing right on its low and being of a very large size – these are bearish signs. The price is in a slightly bouncy but valid long-term downwards trend, below its levels from both three months ago and six months ago and falling with momentum. This pair is always liable to find support or resistance to halt such a move, but the odds favor lower prices over the course of the coming week, especially early in the week, after such a strong fall on Friday. The dangerous factor to watch out for, however, is the long-term inflected low point at 0.6425, which could cause another bounce and possible halt or even reverse the decline.
Conclusion
This week I forecast the best trade will be short NZD/USD.


