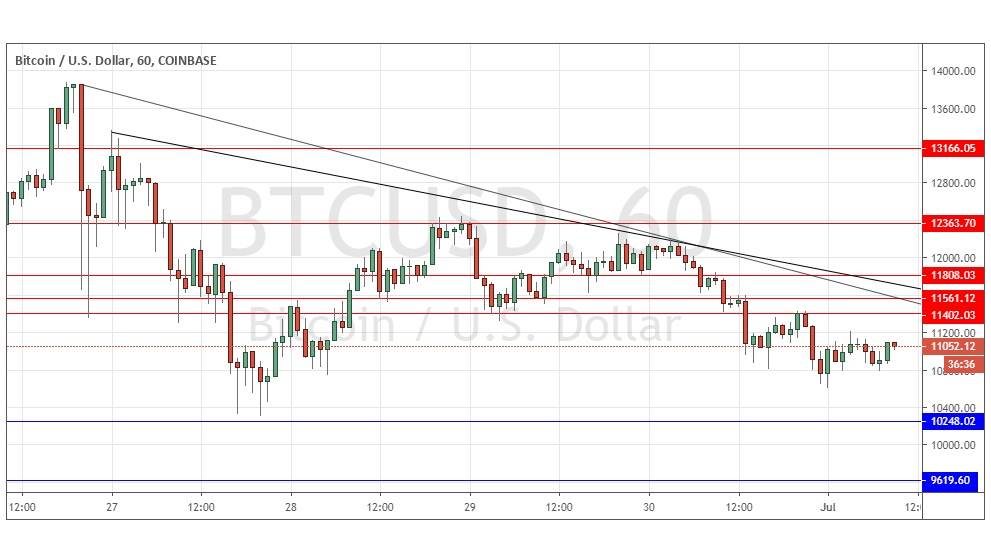
Bitcoin: Strong bearish retracement: medium-term end to uptrend?
Last Thursday’s signals were not triggered, as there was insufficiently bullish price action at the support levels which were reached that day.
Today’s BTC/USD Signals
Risk 0.75% per trade.
Trades must be taken prior to 5pm Tokyo time Tuesday.
Long Trades
Long entry at a bullish price action reversal on the H1 time frame following the next touch of $10,248 or $9,620.
Put the stop loss 1 pip below the local swing low.
Move the stop loss to break even once the trade is $50 in profit by price.
Remove 50% of the position as profit when the trade is $50 in profit by price and leave the remainder of the position to run.
Short Trades
Short entry after a bearish price action reversal on the H1 time frame following the next touch of $11,402, $11,561 or $11,808.
Put the stop loss 1 pip above the local swing high.
Move the stop loss to break even once the trade is $50 in profit by price.
Remove 50% of the position as profit when the trade is $50 in profit by price and leave the remainder of the position to run.
The best method to identify a classic “price action reversal” is for an hourly candle to close, such as a pin bar, a doji, an outside or even just an engulfing candle with a higher close. You can exploit these levels or zones by watching the price action that occurs at the given levels.
BTC/USD Analysis
I wrote last Thursday that the price breaking up above $13,000 but falling back quite sharply, all on much higher volatility, was a major sign that the bullish trend had changed character and that we were likely to see a consolidation for a while, so this was probably going to be the right time for starting to take in any floating profits on long trades and to stand aside for a while.
I was a little wrong as the action has been somewhat more bearish than consolidative, but I was completely right about taking in any profits on any long trades.
The picture remains relatively bearish, within a long-term bullish trend. The key thing to watch for now will probably be whether the price can stay above $10,000 for a while which would be a bullish sign. Another bullish sign will be if the price can get established above the two descending trend lines shown within the price chart below.
It will probably be wise to stand aside from this pair today until we see some technical changes. Concerning the USD, there will be a release of ISM Manufacturing PMI data at 3pm London time.
