The difference between success and failure in Forex trading is very likely to depend upon which currency pairs you choose to trade each week, and not on the exact trading methods you might use to determine trade entries and exits. Each week I am going to analyze fundamentals, sentiment and technical positions in order to determine which currency pairs are most likely to produce the easiest and most profitable trading opportunities over the next week. In some cases it will be trading the trend. In other cases it will be trading support and resistance levels during more ranging markets.
Big Picture 14th July 2019
In my previous piece last week, I forecasted that the best trades would be long of the S&P 500 Index, short of GBP/USD, and short USD/CAD below last week’s low price. The S&P 500 Index rose by 1.14%, the GBP/USD currency pair rose by 0.38%, and the USD/CAD currency pair closed down on the previous week’s low price by 0.09%. These trades add up to an averaged win for the week of 0.28%.
Last week’s Forex market saw the strongest rise in the relative value of the New Zealand Dollar, and the strongest fall in the relative value of the U.S. Dollar.
Last week’s market was dominated by a more dovish tilt from the Chair of the U.S. Federal Reserve on interest rate cuts. This has weakened the U.S. Dollar and pushed the U.S. stock market to new all-time high prices.
The Forex market was less active last week, with almost everything rising just a little against the U.S. Dollar.
This week has a thinner news agenda scheduled compared to last week, so we may well see little movement in the markets over the coming days.
Fundamental Analysis & Market Sentiment
Fundamental analysis now sees the Federal Reserve as more likely to cut rates over the near to medium term as the recent headline strong new jobs number masked a deeper picture of slowing growth. Despite that, the economy is still growing quite strongly, and the U.S. stock market is making new all-time high prices.
Market sentiment is more risk-on and this is playing out mostly outside the Forex market, with stocks, gold, and crude oil advancing against the U.S. Dollar.
Technical Analysis
U.S. Dollar Index
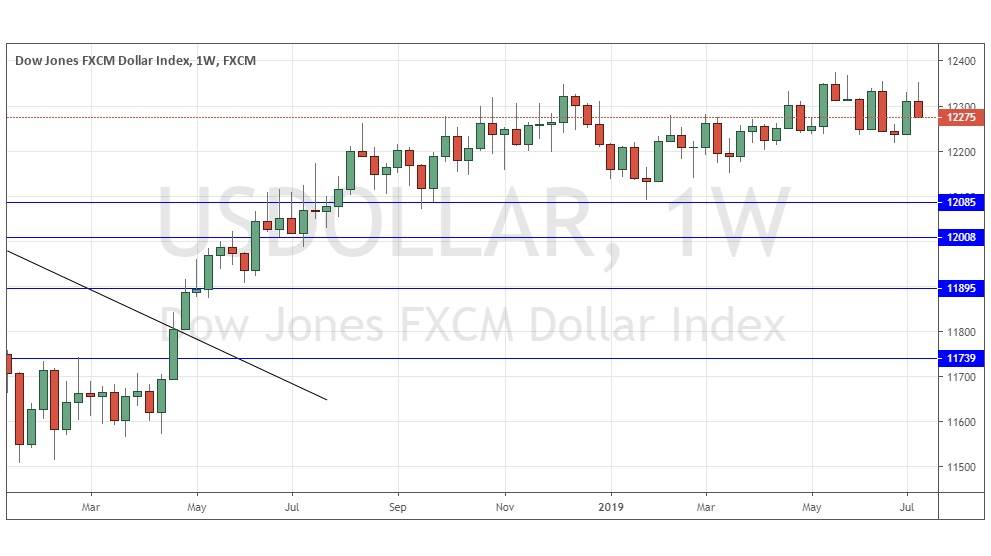
The weekly price chart below shows that last week the USD Index fell, printing a relatively small bearish candlestick which closed right on its low, which is a bearish sign. However, the price is up over both 3 months and over 6 months, indicating a bullish trend. This trend has slowed considerably into a near-consolidation over recent months but remains intact now.
S&P 500 Index
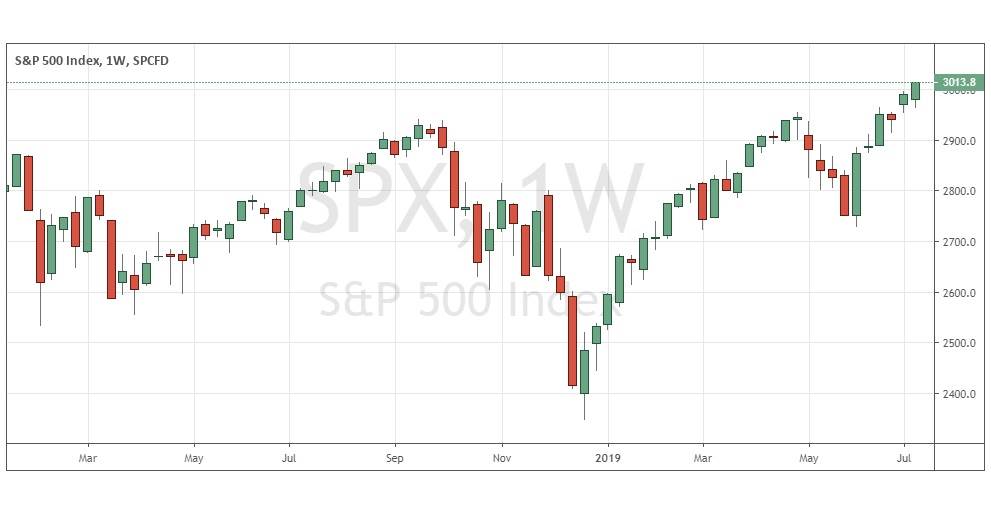
The weekly chart below shows that last week printed a bullish candlestick which closed right on its high, at an all-time high weekly closing price. These are bullish signs; however, volatility was relatively low which suggests that bulls might want to be at least a little cautious here for a sudden reversal. Another positive factor strengthening the bullish case is that the psychological number of 3000 has been surpassed.
USD/CAD
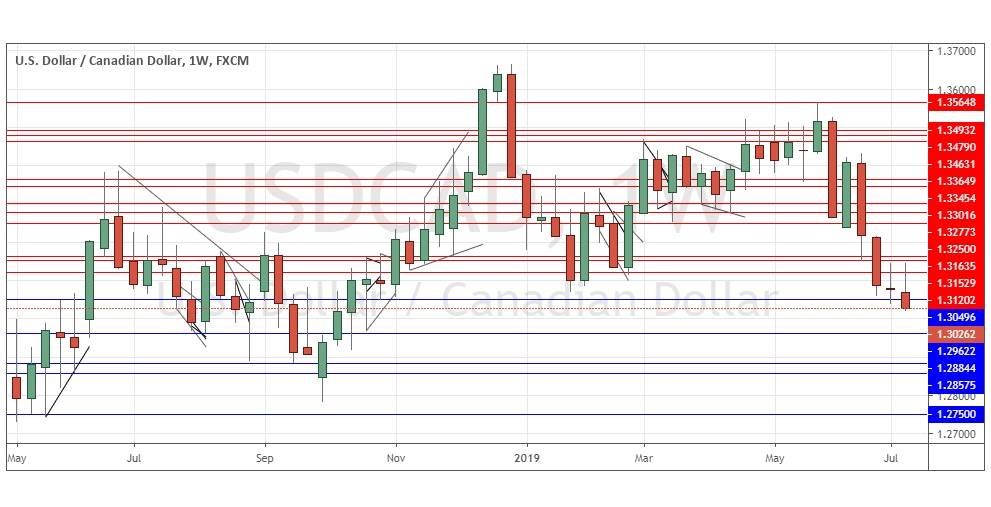
The weekly chart below shows last week saw this pair print another bearish candlestick, which was a pin candlestick which closed very close to its low– these are bearish signs. Although the weekly close was the lowest for nine months, it is concerning that the 1.3000 has continued to hold. Nevertheless, it is worth taking a cautious bearish bias here.
GOLD/USD
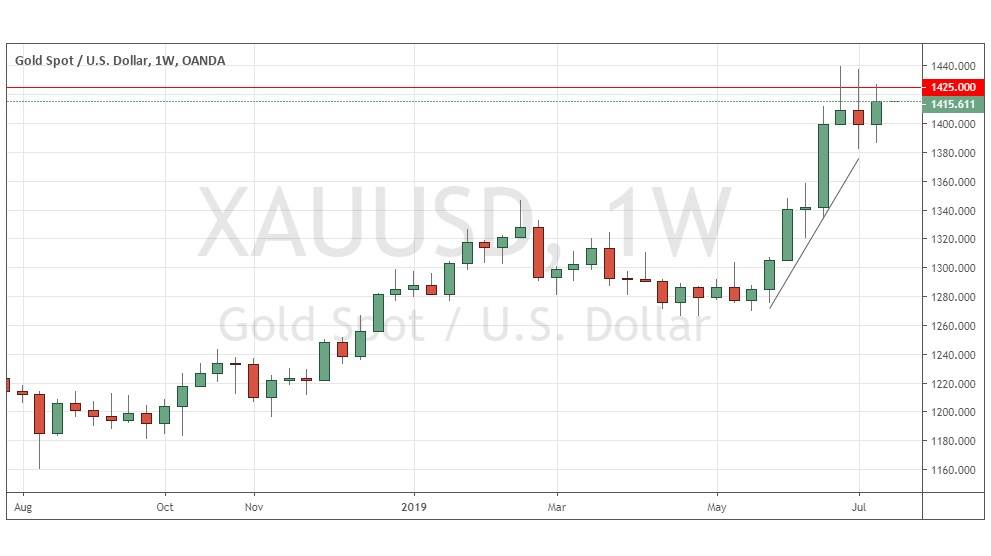
The weekly chart below shows that last week printed a bullish inside candlestick which closed at a near 6-year high weekly closing price. These are bullish signs; however, volatility was low and the big psychological level at $1425 is just ahead of the current price, which suggests that bulls might want to be at least a little cautious here.
Conclusion
This week I forecast the best trades will be long of the S&P 500 Index, long Gold in USD terms following a daily close above $1425, and short USD/CAD.


