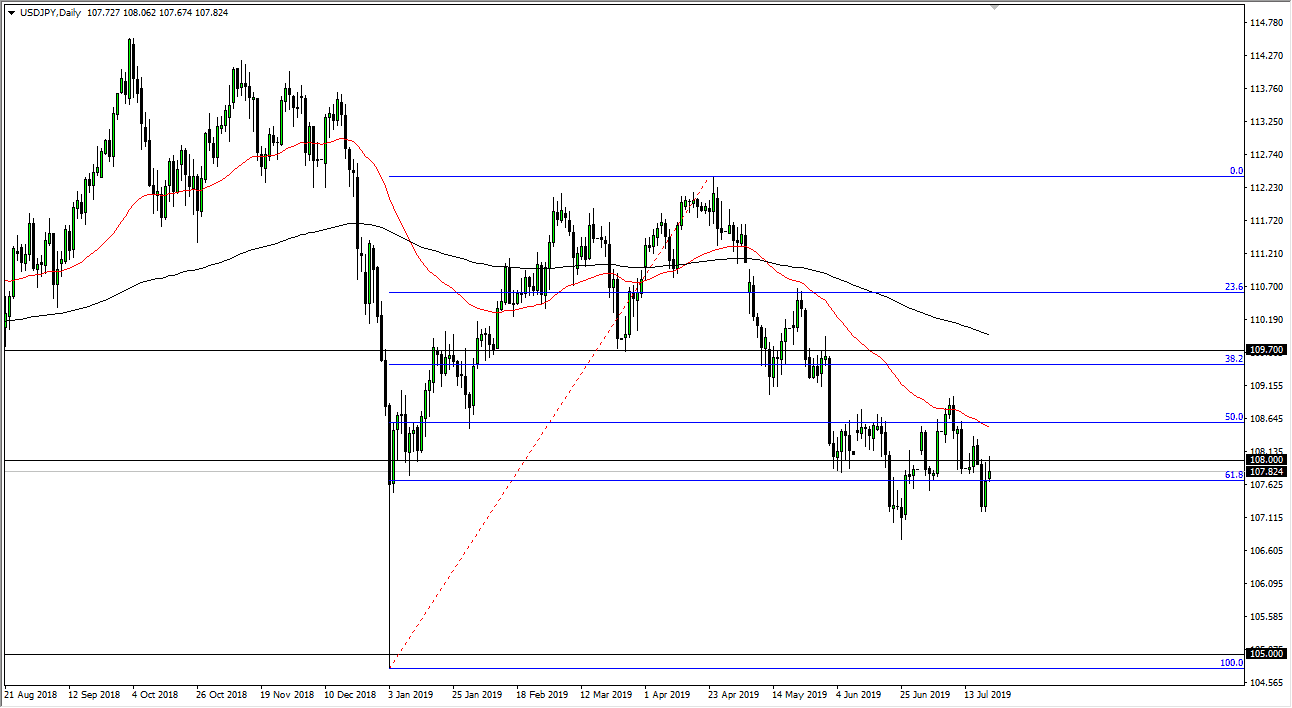
The US dollar initially tried to rally during the trading session on Monday but found plenty of resistance at the ¥108 level that has turned the market around. We don’t necessarily have a shooting star, but something close enough to it that makes sense. I think that pulling back from here makes quite a bit of sense, and therefore if we pull back I think will go looking towards the support level underneath. I believe that support level is closer to the ¥107 level, and I think that’s an area where we could see a lot of interest from the buyers.
Risk appetite
The USD/JPY pair is very likely to react towards the risk appetite of traders around the world as the Japanese yen is without a doubt one of the most important safety currencies out there that we can be involved in. The US dollar is also a safety currency, but it is not as much of a safety currency as the Yen is. That being the case, the market is probably going to see a lot of selling pressure again as we approached the ¥108 level, and I also see a couple of other areas above that could cause a bit of trouble.
One of the best barometers of risk appetite is the S&P 500, which has been very quiet during the trading session on Monday so it’s not a huge surprise that we did really go anywhere. If we do break above the highs of the trading session on Monday, then we will probably go looking towards the 50 day EMA above. This should be parallel to the S&P 500 breaking to the upside which is currently struggling with the idea of staying above the 3000 handle. If we do, it’s very likely that the market reaction should be positive for this pair.
However, if we start to see a major selloff in the S&P 500, it’s very likely there will be a bit of a “risk off” move, and that should have money flowing towards the Japanese yen. In other words, it works in both directions.
Levels to watch
The ¥108 level of course is resistance, but I also see the ¥108.75 level as another major resistance barrier. If we were to clear that level, then we will try to take out the “wipeout candle” which started at the ¥109.65 level. Moving above there changes the entirety of the trend, and since this market much higher.
However, if we break down below the ¥107 level, that would be a very negative sign and send this market much lower. By breaking through that level on a daily close, it would signify that this pair is ready to go lower, perhaps reaching down towards the 100% Fibonacci retracement level. That is roughly ¥105 and would wipe out the entire move to the upside. At this point, we are going to make a move in one direction or the other but may dance around in this overall short-term range in the meantime.

