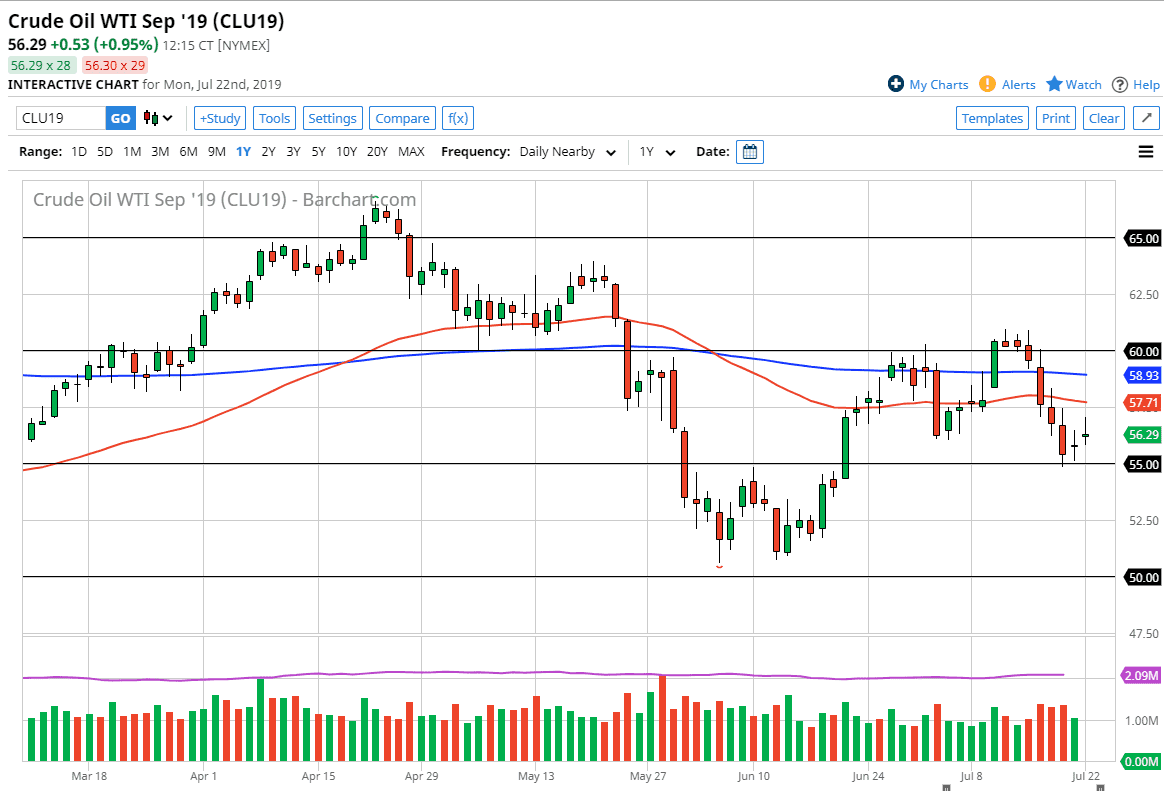
The WTI Crude Oil market initially gapped higher during the trading session on Monday, and then shot towards the $57 level. At that point, we ended up pulling back to form a bit of a shooting star, which of course is a very negative sign. Overall though, there are a whole plethora of reasons that I am becoming more and more bearish of crude oil overall. The price action is one of the reasons, but there’s a whole laundry list.
Fundamental reasons
The fundamental reasons why WTI Crude Oil continues to struggle are numerous. Not the least of which is the fact that the global economy is slowing down, and it looks like the demand for crude oil will suffer as a result. This is quite typical, because if industry is in going at full tilt, obviously it demands less in the way of energy. Beyond that, we also have geopolitical tensions that seemingly are ignored. As the Iranians and the Americans continue to go back and forth, and oil ignores all of these tensions ratcheting up, this tells me everything I need to know about the market: that there has been a fundamental shift in the way oil is priced.
The United States supplies 75% of its crude oil domestically, and then gets a majority of the rest of the crude oil from its neighboring Canada. The Iranians are but an afterthought. This is more about the Europeans that it is North America, which is where all of the demand for energy is coming from currently anyway. Beyond that, this is more of an Asian problem than anything else.
Price action
The candle stick for the trading session on Monday is very negative looking, even though we tried to gap higher. Star shaped candle suggests that we are going to drop a bit from here, perhaps trying to test the $55 level underneath. That’s an area of that has caused a bit of a bounce and that shouldn’t be much of a surprise considering that it’s a large, round, psychologically significant figure. Even with that, I believe that we will eventually break down below that level, but it may take several attempts. The crude oil market does tend to move in five dollar increments, and I don’t see anything on this chart that’s going to change that situation.
The 50 day EMA is sitting just above the $57.50 level, which is also just above the candle stick for the day. The market breaking above there would of course be very bullish, but at this point it just doesn’t seem like it’s going to happen anytime soon. With that in mind I continue to short rallies that show signs of exhaustion on short-term charts, although I don’t necessarily believe we are going to see massive moves in the near term. That being said, I believe that this market continues to be very negative, but we may have the occasional short-term bounce.

