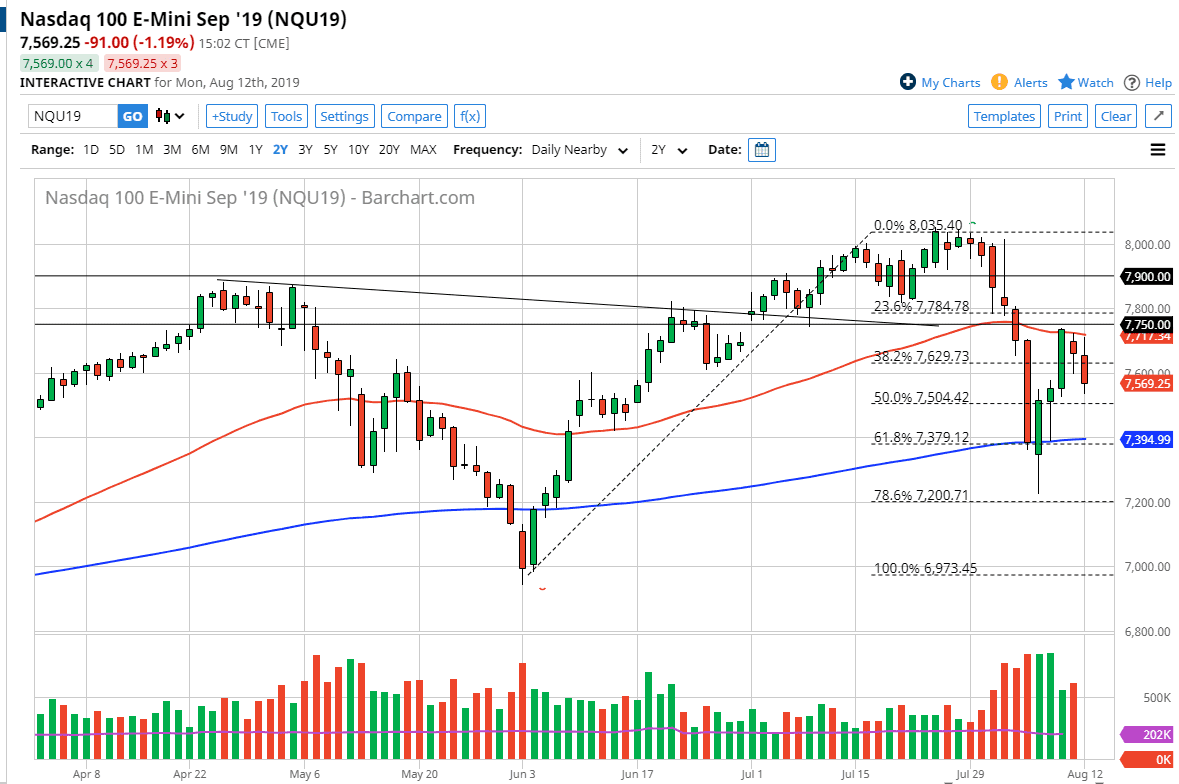
The NASDAQ 100 has fallen a bit during the trading session on Monday after initially trying to rally. We ran into the 50 day EMA which of course is a large, round, psychologically significant moving average that people pay attention to, as well as what could be thought of as an extension of the downtrend line that I have marked on the chart. At this point though, I think there are arguments to be made for both sides of the equation when it comes to trading the NASDAQ 100.
Underneath we have the 200 day EMA which is colored in blue, and it looks very likely to offer if we can support as it typically will do for longer-term traders. Not only does it have a knack for doing so, but we also have the 61.8% Fibonacci retracement level hanging around the same area and of course the 7400 level. Looking at the chart, I believe that we are going to continue to bounce back and forth between these two EMA levels, at least until we get some type of clarity as to what’s going on with economic growth and of course the trade wars.
I suspect that the market is going to find a lot of difficulty hanging onto gains as the United States and China continue to bicker. As long as that’s going to be the case, I suspect that the stock markets in general will continue to struggle, but the NASDAQ 100 is especially sensitive because it is based upon technologically sensitive companies, which of course is a huge portion of the commerce done between the United States and China. Huawei is a perfect example, as it uses so many components from American technology companies.
With that being said, I believe that the market is going to be choppy and erratic, and therefore it’s likely that we will continue to use both of these moving averages as support and resistance, so in the short term I am simply looking to trade back and forth. I would use short-term charts to use as indications as to when to buy and sell, but I think we are probably stuck in this range until we can get some type of clarity. Once we close either above or below this area on a daily close, then we could start to talk about a bigger move. Until then, it’s all about the short-term charts.


