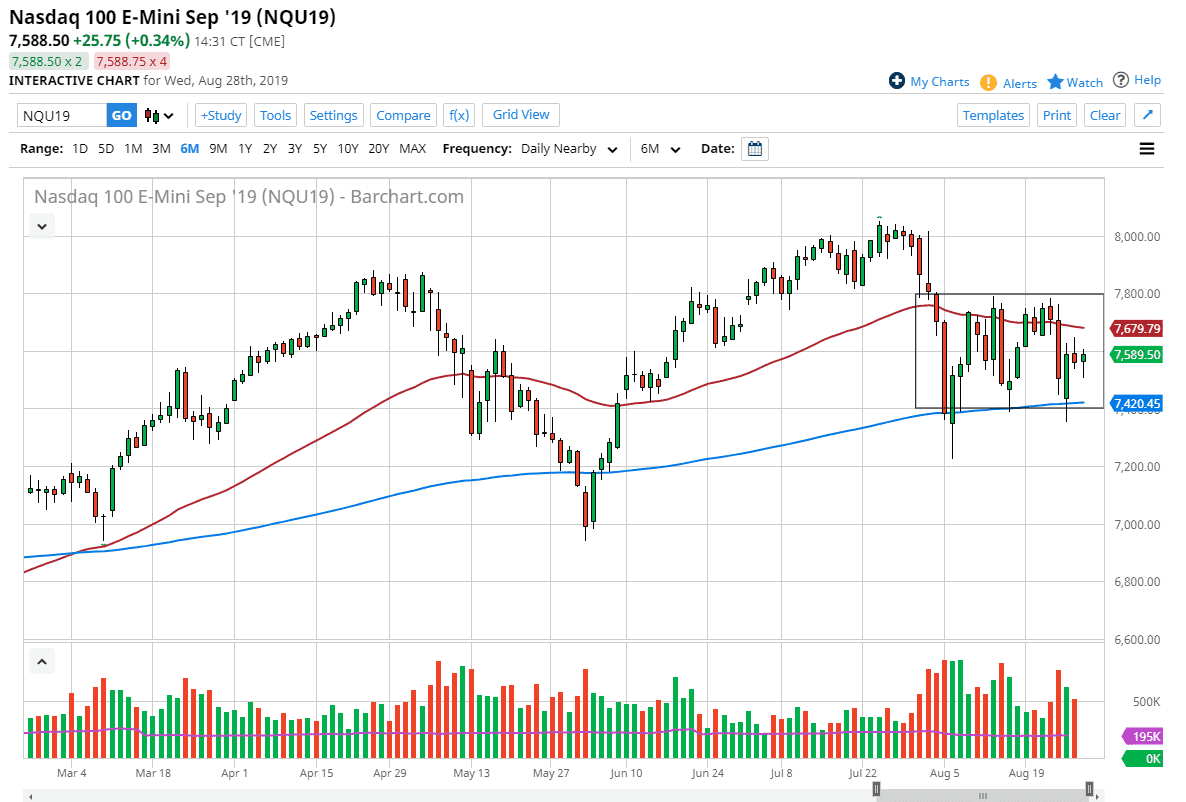
The NASDAQ 100 has continued to go back and forth during the trading session on Wednesday, as we have seen on Tuesday. Ultimately, this is a market that sees a lot of volatility going forward, which makes quite a bit of sense considering that the technology stocks are so sensitive to the US/China trade relations. As that continues to be very sour, it’s likely that the market will continue to go back and forth over here.
At this point, I think that we are stuck in a consolidation area that will continue to find plenty of buyers and sellers going back and forth, with the 7400 level underneath being massive support, as the 7800 level above is massive resistance. Ultimately, when you look at this chart it’s likely that the 200 day EMA underneath continues offer massive support, just as the 50 day EMA above offers massive resistance. At this point, the market continues to see a lot of volatility back and forth here, which makes quite a bit of sense as we are essentially waiting for the next headline to drop out of the US/China trade relations. Things simply aren’t good, so it’s very unlikely that the market can take off to the upside with any sense of stability.
Ultimately, if we can break above the 7800 level it’s likely that we would then go to the 8000 handle. On the other side of the equation, if we break down below the 7400 level, it’s likely that we will go looking towards the 7200 level. Between now and then, we are simply looking for opportunities to buy and sell in this box that I have drawn on the chart, offering a good day trading environment if you have the ability to react quickly. That being said, keep in mind that the occasional tweet or headline will cause both bullish and negative actions in this market as seen over the last couple of weeks. It appears that we should continue to see quite a bit of noise but it’s only a matter of time before we see reason enough for a larger move, but until we get that impulsive candle that should be easy to see, it’s going to be difficult to hang onto a trade for more than a few hours. That being said, look at the outline of the box and keep that on your chart as guidelines going forward.


