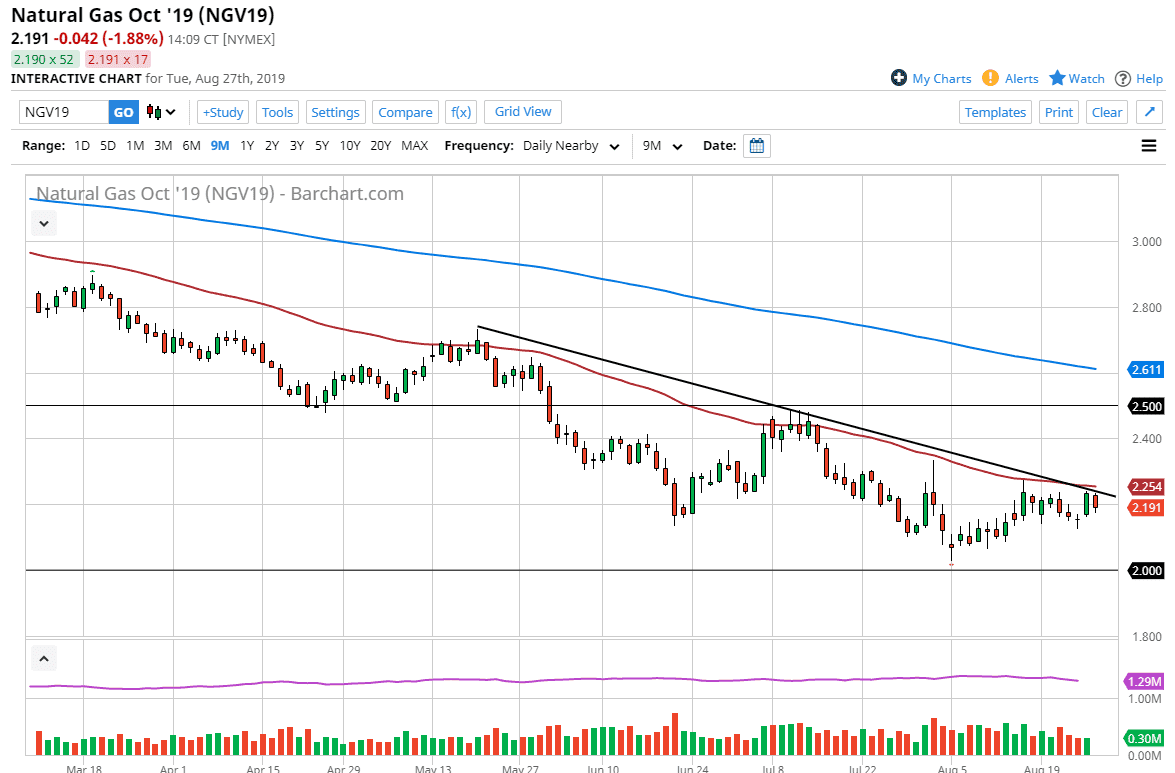
The natural gas markets fell during the trading session on Tuesday, as we continue to see a lot of resistance above and it’s likely that we will continue to go lower. At this point, the 50 day EMA above continues offer quite a bit of resistance, and of course the downtrend line of course will cause major resistance. The candle stick from the day is negative and it looks like we have all but wiped out the bullish pressure from the Monday session.
The downtrend has been rather strong and it makes quite a bit of sense considering that there is so much in the way of oversupply, and it’s likely that we are going to continue to favor the downside from a longer-term standpoint, but also you should keep in mind that the market is highly cyclical, trading lower most of the time but sometimes we start focusing on colder months, and therefore we see natural gas take off to the upside. We are not quite there yet, but this is a market that looks likely as if it is trying some type of basing pattern. Ultimately, the market could break down to the $2.00 level again, an area that it has bounced from rather significantly. This is a market that should continue to look at that as a major barrier, and I think a lot of traders will be looking to trip stop loss orders down there. If they do, we could get a massive flush lower and the payoff would be quite nice. However, we are running out of time and it’s likely that although an attempt to reach that level will be made, I don’t know that there will be follow-through.
To the upside, if we can break above the 50 day EMA on a daily close, it’s likely that we could go much higher. Otherwise, we simply are killing time until we trade colder months, perhaps the November contract, so therefore it’s a short-term “sell the rallies” type of situation going forward. Longer-term, we will finally get some type of impulsive weekly candle stick that we can start buying, which will come sooner or later. In the short term I would anticipate that traders will continue to see every $0.10 or so cause either support or resistance and therefore you will need to find short-term charts to take advantage of.


