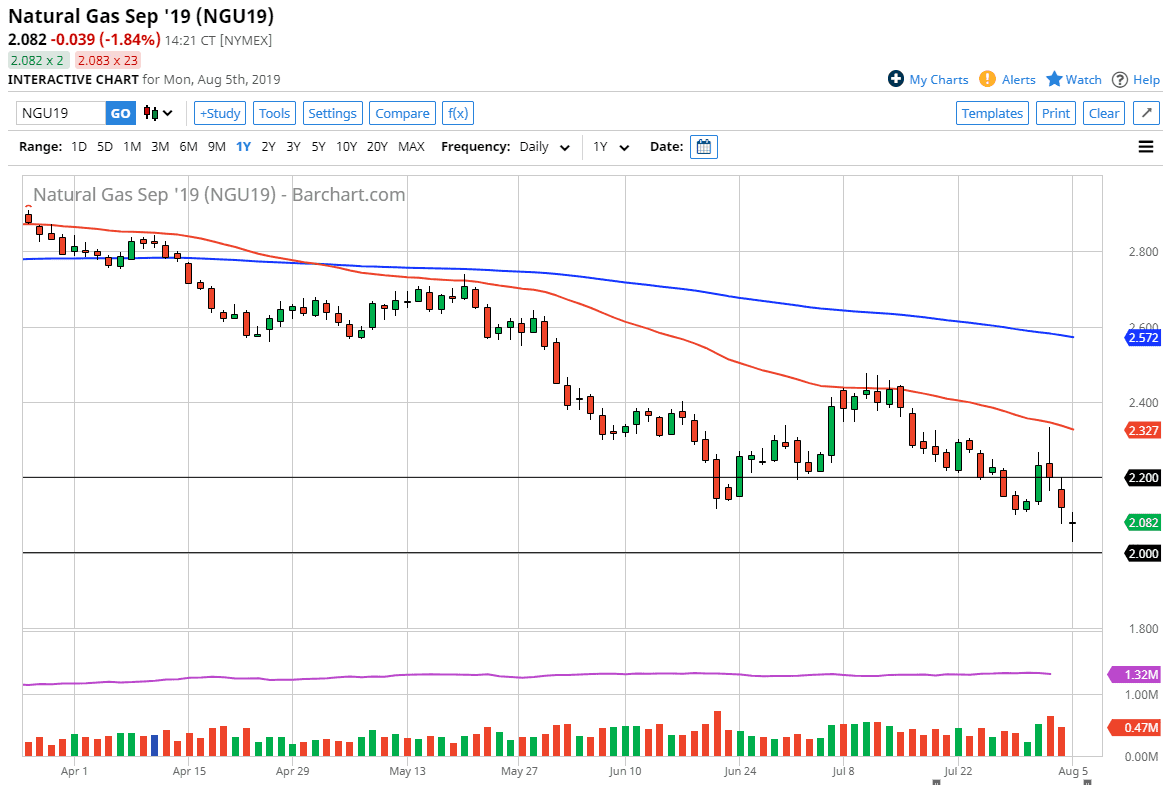
Natural gas markets gapped lower to kick off the Monday trading session before grinding even lower. At this point, the market continues to show a lot of negative behavior. Natural gas markets are bearish and they should be, considering that we are oversupplied of the commodity. With that in mind, we continue to see sellers step into this market every time it rallies.
It looks as if it’s one of those times, when the buyers come back in and start pushing higher. However, I do see a multitude of reasons above the think that we will break back down. The $2.20 level above is the beginning of significant selling pressure, as seen on the Thursday candle stick which was such a massive shooting star. Beyond that, we have the 50 day EMA which is at the top of the shooting star, and as a result I think that the market will continue to pay attention to those areas for selling opportunities.
I believe that the market will continue to see a lot of volatility, and at this point it looks like we are going to recover a bit from the extreme lows. That being said, the $2.00 level underneath is massive support, and of course a large, round, psychologically significant figure. With that, I think that the $2.00 level will attract a lot of attention, and I think that the buyers will continue to try to defend that level. However, we have not actually reached the $2.00 handle, so I think that we will make another attempt.
I am simply looking at this market is one that will offer opportunities to sell again at higher levels. I think at this point it’s obvious that we are in a downtrend and obviously the overall fundamental picture for natural gas isn’t going to change longer term. However, we will eventually get some type of switch to the colder months in the next couple of contracts, and once that happens, natural gas tends to have an explosive couple of months. It’s going to take a while though, as the market will be waiting for colder temperatures. We don’t have that yet, so in the meantime it looks like a “sell the rallies” type of situation going forward. In fact, I don’t think that changes until we get a daily close above the 50 day EMA which is painted in red on the chart.


