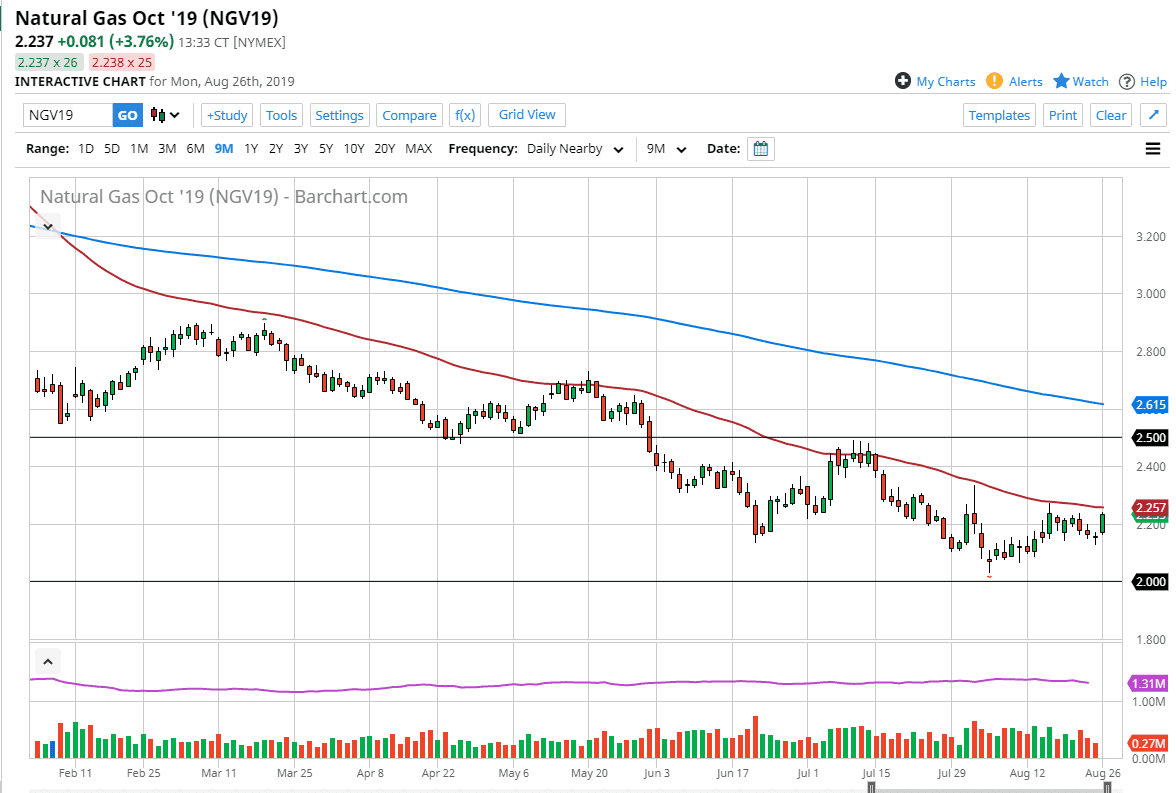
Natural gas markets have rallied significantly during the trading session on Monday as traders returned from the weekend. We are approaching the $2.25 level, which is where we find the 50 day EMA. It’s very likely we should continue to see sellers near that area as the 50 day EMA has been so crucial for the trend.
Looking at this chart, we are obviously in a very strong downtrend, and even though the candle stick for the trading session on Monday is so strong, it’s likely that we will find that the sellers are going forward. After all, the natural gas markets are far oversupplied and it’s difficult to imagine a scenario that Africa suddenly becomes in huge demand until we get to colder months. We are currently trading the October contract, and that of course is not the dead of winter for the northern hemisphere, so at this point it’s obvious that demand will be able to absorb all of the supply right now.
That being said, we will eventually get that rally but we need to clear either the $2.50 level before trying to buy this market, or just simply wait until we trade the November contract or perhaps even later. In the meantime, I like fading the first signs of exhaustion and will probably have to look towards short-term charts in order to do so. At this point, it’s likely that we will eventually try to reach down towards the $2.00 level, an area that was tested recently. I think traders won’t give up on the idea of running those stops, but I don’t know if they can because we are starting to get relatively late in the year to see that happen. Nonetheless, I believe that it least in the short term we are looking to sell this market.


